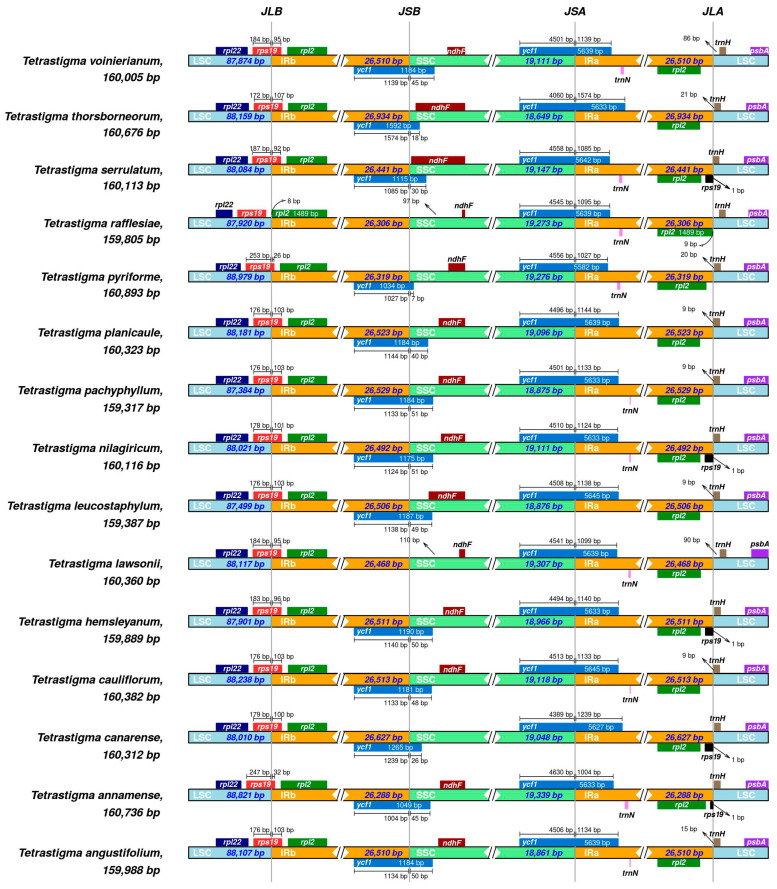
Figure 7.
Comparison of LSC, SSC, and IR boundaries in the chloroplast genomes of 15 Tetrastigma species. Genes are annotated in assorted colors and are labeled with their distances from the boundaries and the lengths of these distances. The lengths of these color blocks are not indicative of the gene lengths but are compressed or expanded based on the differing distances. LSC, SSC, and IR regions are represented in assorted colors. JLB, JSB, JSA, and JLA, respectively, denote the boundaries of the four regions.

