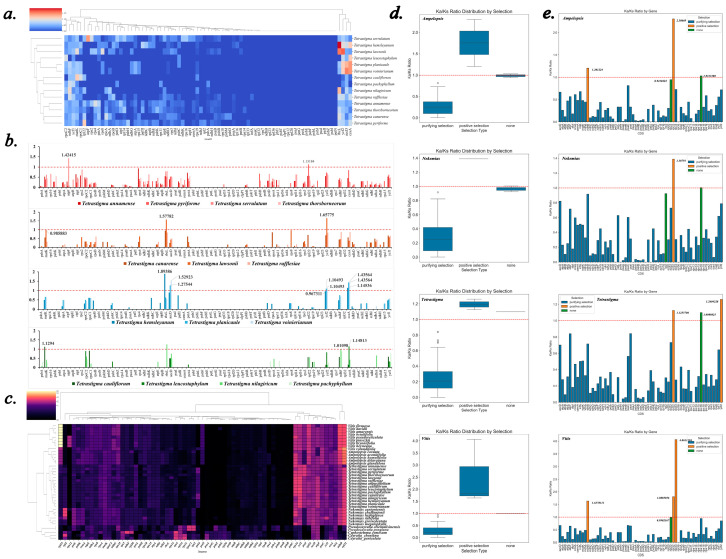
Figure 10.
Selective pressure analysis results. (a) Cluster heatmap showing the Ka/Ks values of chloroplast genomes from 14 species, using Tetrastigma angustifolium as a reference, the Ka/Ks value varies between 0 and 2, corresponding to a color range of blue to red. (b) A set of graphs displaying the Ka/Ks values of each gene, dividing 14 species into four groups according to the result of the phylogenetic tree. (c) Cluster heatmap showing the Ka/Ks values of chloroplast genomes from 40 species, using Leea guineensis as a reference. The Ka/Ks value varies between 0 and 5, corresponding to a color range of black to yellow. (d) Box plots divided into four units by genus, taking the arithmetic mean of the Ka/Ks values of the common CDS of different species and obtaining a box plot to display the distribution of data. (e) Bar charts drawn by dividing the Ka/Ks values of the common CDS of different species into four units based on their genus, taking the arithmetic mean. Orange represents positive selection, blue represents purifying selection, and green represents Ka/Ks close to 1, indicating no significant selection.

