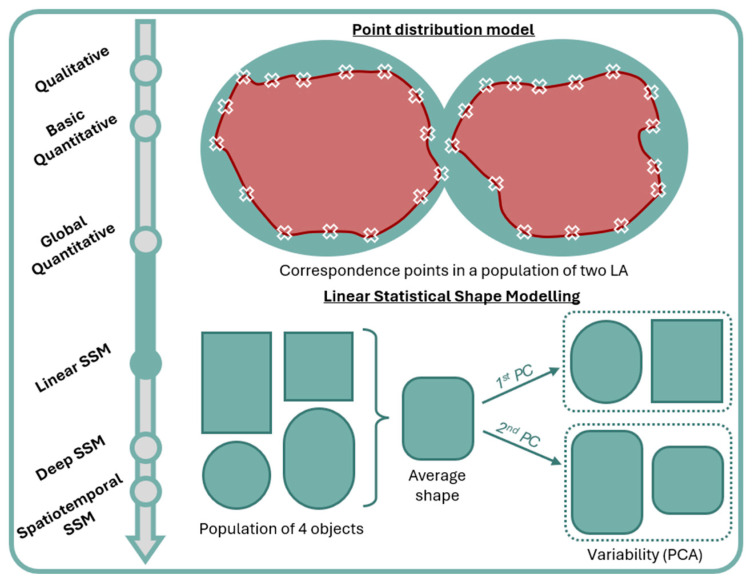
Figure 3.
Correspondence points (white ‘X’ symbols) in a point distribution model and average shape and shape variability in a linear SSM. First PC captures the roundedness of edges and second PC captures the ratio of width to length. LA: left atrium; PC: principal component; PCA: principal component analysis; SSM: statistical shape modeling.

