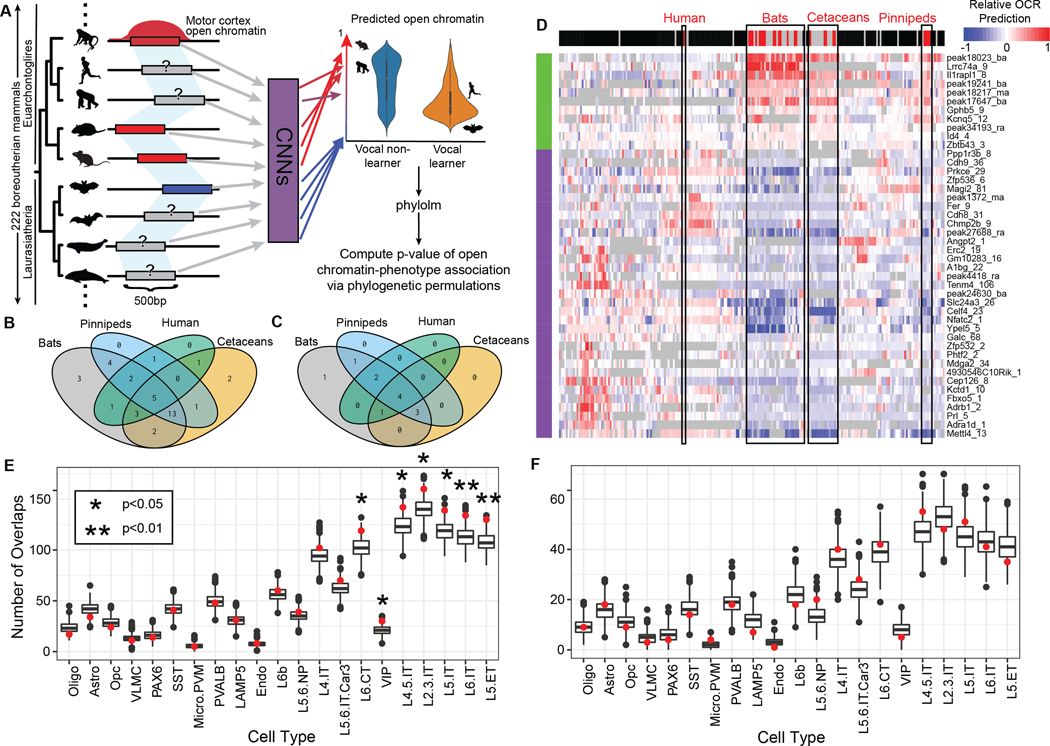
Figure 4. Vocal learning-associated convergent evolution in motor cortex open chromatin regions implicates specific neuron subtypes.
(A) Overview of applying the Tissue-Aware Conservation Inference Toolkit (TACIT (23)) approach to vocal learning. OCRs (left) identified in motor cortex (M1). Measured open chromatin from M1 (4 species) were used to train convolutional neural networks (CNNs) to predict M1 open chromatin from sequence alone. Red bars and corresponding arrows indicate the presence of a peak while the blue bars represent the absence. The same OCRs were then mapped across 222 mammalian genomes (left) and the identified sequences were used as input to the CNNs to predict open chromatin activity. TACIT identified OCRs whose predicted open chromatin across species was significantly associated with those species’ vocal learning status. (B-C) The 4-way Venn diagrams represent the number of OCRs implicated by TACIT (both M1 and PV+) as displaying low (B) or high (C) activity in each of the vocal learning clades based on a t-test. (D) The heatmap visualizes specific open chromatin regions along the rows (predicted higher in vocal learners in green; predicted lower in vocal learners in purple) across 222 mammals in the columns (vocal learner in red, vocal nonlearner in black, insufficient or conflicting evidence in gray). The color in each cell corresponds to the z-scored predicted open chromatin, with low open chromatin in blue, mean open chromatin in white, and high open chromatin in red. For open chromatin regions predicted to be significantly less (E) or more (F) open in vocal learning species (p<0.05), the red point shows the number of overlapping regions (y-axis) across mouse cortical cell types (x-axis). The bar-plot shows the distribution across 1,000 permutations of the peaks implicated by TACIT. The notches extend 1.58 * IQR / sqrt(n), which gives a roughly 95% confidence).

