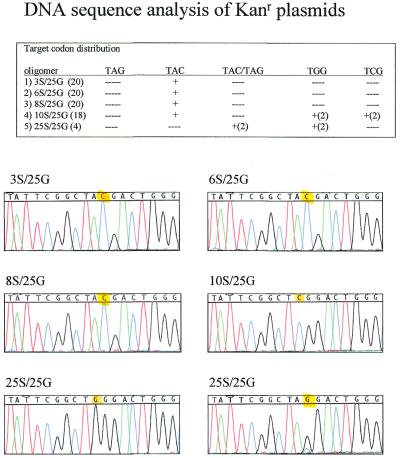
Figure 3.
DNA sequences of representative kanr colonies. Confirmation of sequence alteration directed by the indicated molecule is presented along with a table outlining codon distribution. Note that 10S/25G and 12S/25G elicit both mixed and unfaithful gene repair. The number of clones sequenced is listed in parentheses next to the designation for the single-stranded oligonucleotide. A plus (+) symbol indicates the codon identified while a figure after the (+) symbol indicates the number of colonies with a particular sequence. TAC/TAG indicates a mixed peak. Representative DNA sequences are presented below the table with yellow highlighting altered residues.

