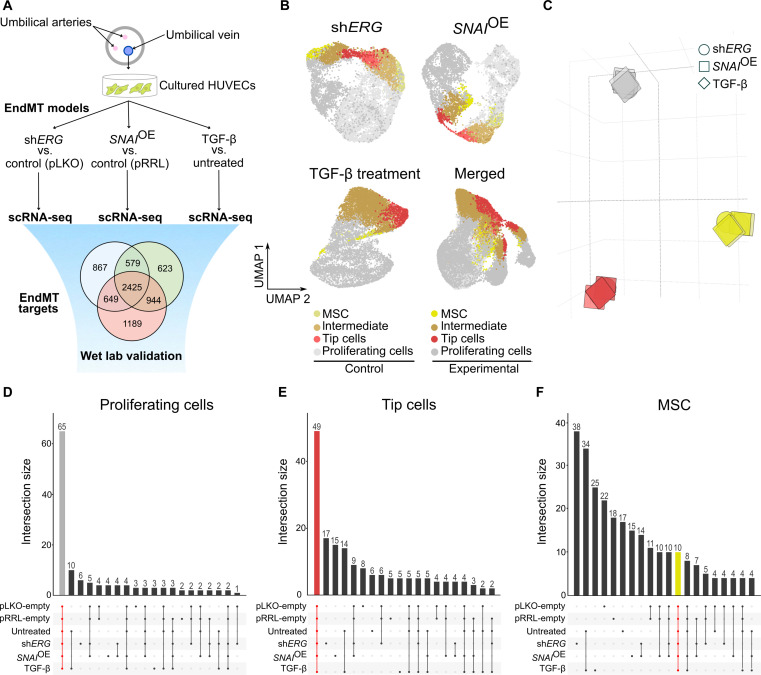
Fig. 1. scRNA-seq identifies congruent marker genes across three in vitro EndMT induction models.
(A) Graphical representation of the experimental design. (B) UMAP analysis of 32,125 cultured HUVECs from ERG silencing (shERG), SNAI1 overexpression (SNAIOE), and TGF-β experiments. (C) Principal components analysis (PCA) on the pairwise Jaccard similarity coefficients between the top 100 marker genes of cultured EC phenotypes. (D) Upset plot visualization showing the number of congruent genes (65 in gray) in the top 100 proliferating cell marker genes in cultured ECs. (E) Upset plot visualization showing the number of congruent genes (49 in red) in the top 100 tip cell marker genes in cultured ECs. (F) Upset plot visualization showing the number of congruent genes (10 in yellow) in the top 100 mesenchymal cell marker genes in cultured ECs.

