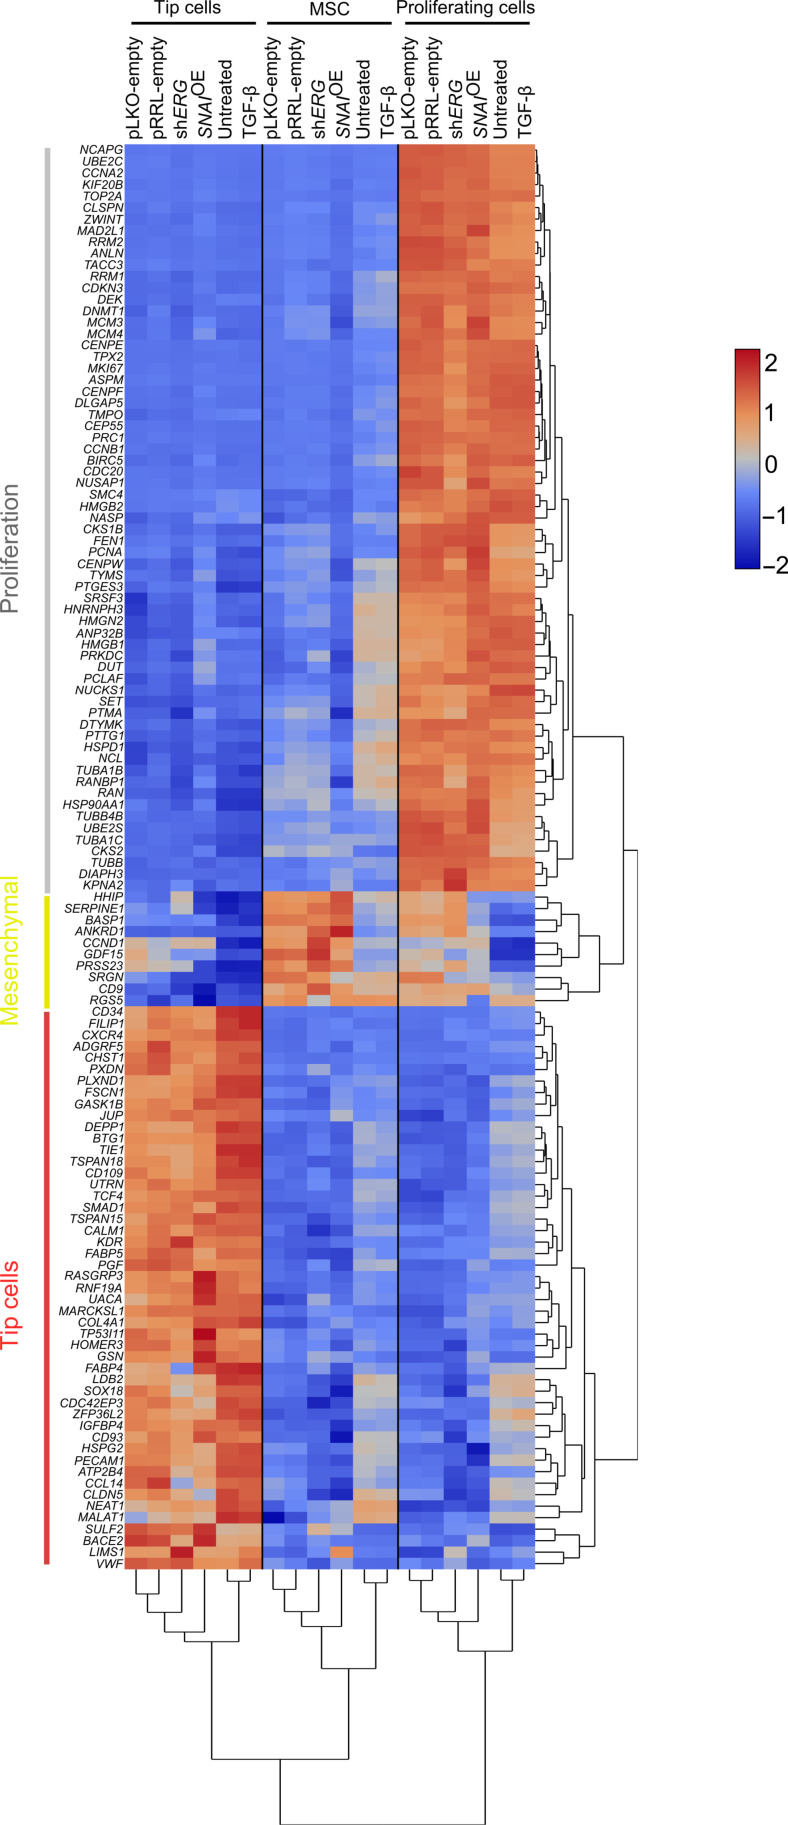
Fig. 2. EndMT gene signatures are similar within each model and condition.
Heatmap and hierarchical clustering analysis of the 124 congruent marker genes of all cell states. Note: Marker genes for the intermediate cluster were not calculated since it represents a transitional phase between tip cells and MSCs.

