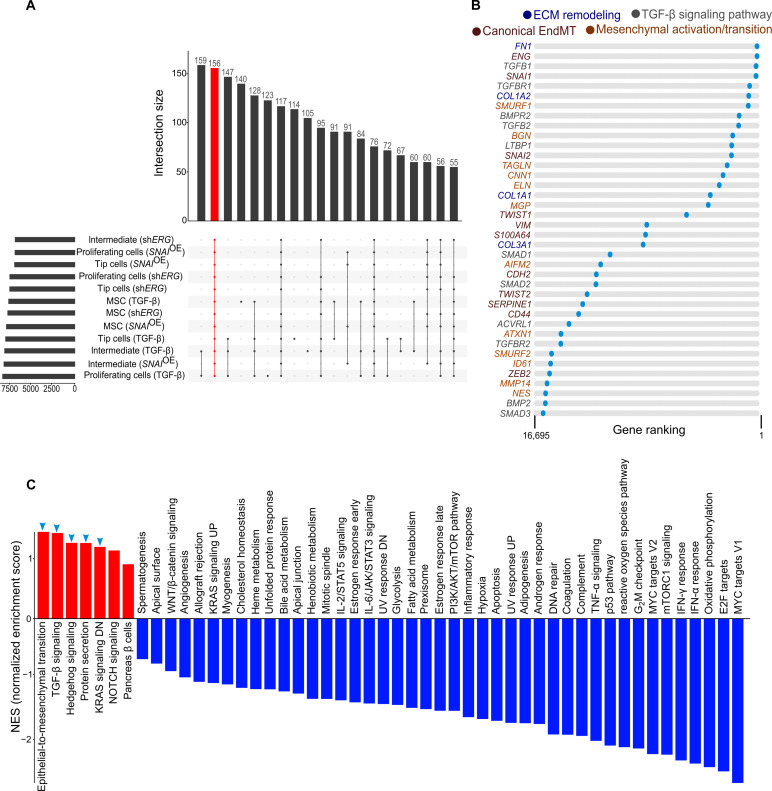
Fig. 3. EndMT induction induces expression changes independent of cellular differentiation state.
(A) Upset plot visualization showing the number of congruently up-regulated genes (red) in EndMT induction independent of cellular differentiation state. (B) String plots indicating canonical EndMT markers, genes involved in mesenchymal activation, ECM remodeling, and TGF-β signaling pathway as for color code. (C) Bar plot showing GSEA performed on the ranked list of genes of the cell state–independent EndMT rank-based meta-analysis for the hallmark gene sets. Up-regulated gene sets are indicated by blue arrowheads.

