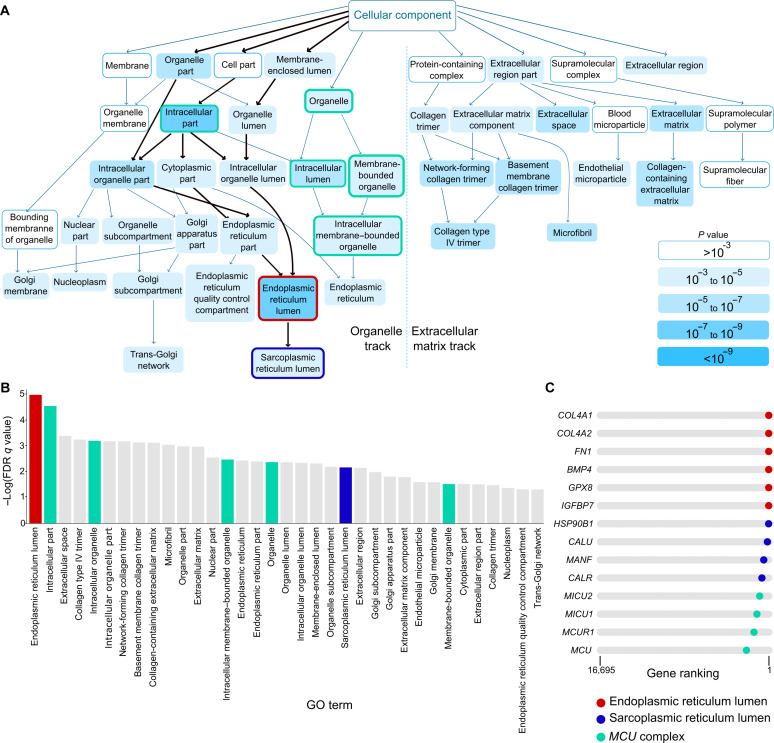
Fig. 4. GO analysis reveals mitochondrial Ca2+ changes.
(A) Graph of enriched GO terms obtained by GOrilla GO enrichment analysis on the ranked list of genes of the cell state–independent EndMT rank-based meta-analysis. The organelle track and ECM track are separated by a vertical dotted line. The path to the ER/SR lumen is highlighted by bold arrows. The ER and SR lumen terms are highlighted by a red and a blue outlines, respectively. Terms that contain genes associated with mito-Ca2+ signaling are highlighted by a green outline. (B) Bar plot showing the order of terms according to adjusted P value of the GOrilla GO enrichment analysis performed on the ranked list of genes of the cell state–independent EndMT rank-based meta-analysis. The ER and SR lumen terms are highlighted in red and blue, respectively. Terms that contain genes associated with mito-Ca2+ signaling are highlighted in green. FDR, false discovery rate. (C) String plots indicating the rank of ER lumen, SR lumen, and MCU complex genes in the cell state–independent EndMT rank-based meta-analysis.

