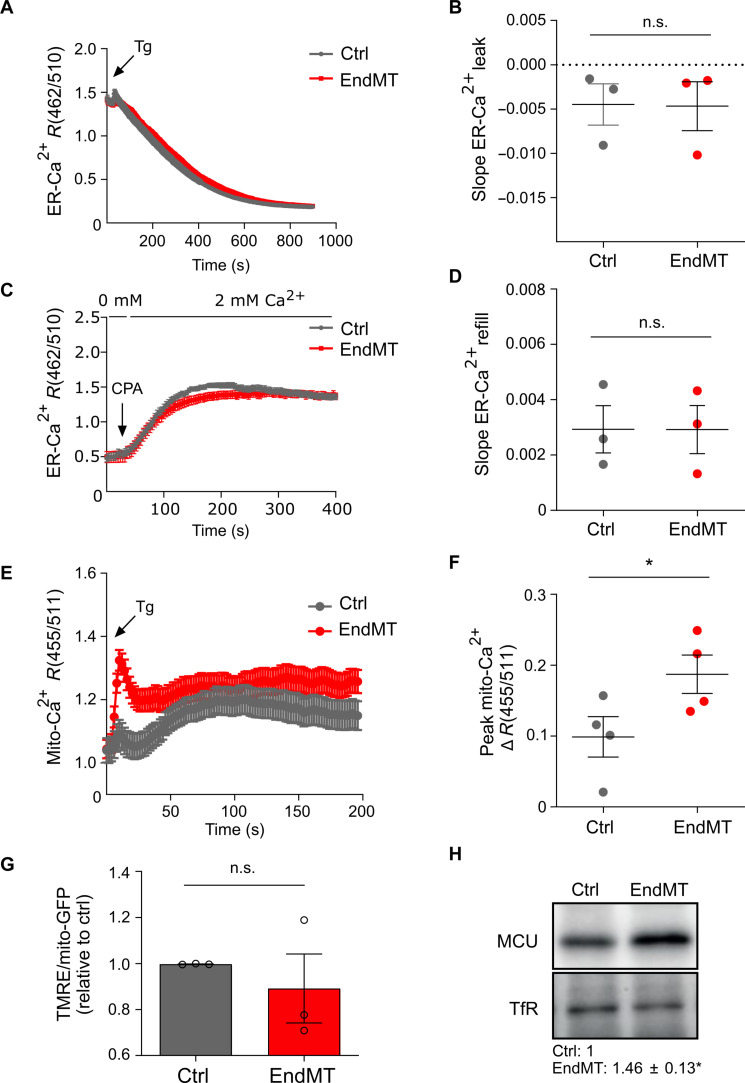
Fig. 5. EndMT is associated with increased mitochondrial Ca2+ uptake.
(A) ER-Ca2+ imaging traces in response to Tg (2 μM) in control cells (gray trace) and EndMT-derived HUVECs (TGF-β1 stimulation; red trace) maintained in 0 mM extracellular Ca2+ solution. Traces represent the mean CEPIA ratio (462/510 nm) ± SEM of different cells from one representative experiment. (B) Mean slope ± SEM of Tg-mediated ER Ca2+ release relative to three independent experiments. n.s., no significance. (C) ER-Ca2+ imaging traces in response to cyclopiazonic acid (CPA; 20 μM) in control cells (gray trace) and EndMT-derived HUVECs (TGF-β1 stimulation; red trace) maintained in 0 mM extracellular Ca2+ solution during stimulation, followed by the addition of 2 mM extracellular Ca2+ to measure ER refill. Traces represent the mean CEPIA ratio (462/510 nm) ± SEM of different cells from one representative experiment. (D) Mean slope ± SEM of Tg-mediated ER Ca2+ release relative to three independent experiments. (E) Mito-Ca2+ imaging traces in response to Tg (2 μM) in control (gray trace) and EndMT-derived HUVECs (TGF-β1 stimulation; red trace) maintained in 0 mM extracellular Ca2+ solution. Traces represent the mean GECO ratio (455/511 nm) ± SEM of different cells from one representative experiment. (F) Mean peak amplitude ± SEM of Tg-mediated mito-Ca2+ uptake relative to four independent experiments. *P < 0.05. (G) Quantification of the intensity of the dye tetramethylrhodamine ethyl (TMRE) that stains polarized mitochondria in control and EndMT-derived HUVECs (TGF-β1 stimulation; n = 3). Values were corrected for the mitochondrial content (mito-GFP). (H) Representative expression levels and relative quantification of immunoblot for MCU in control and EndMT-derived HUVECs (TGF-β1 stimulation; n = 4). Expression levels were normalized to transferrin receptor (TfR; loading control), and they are relative to control. *P < 0.05.

