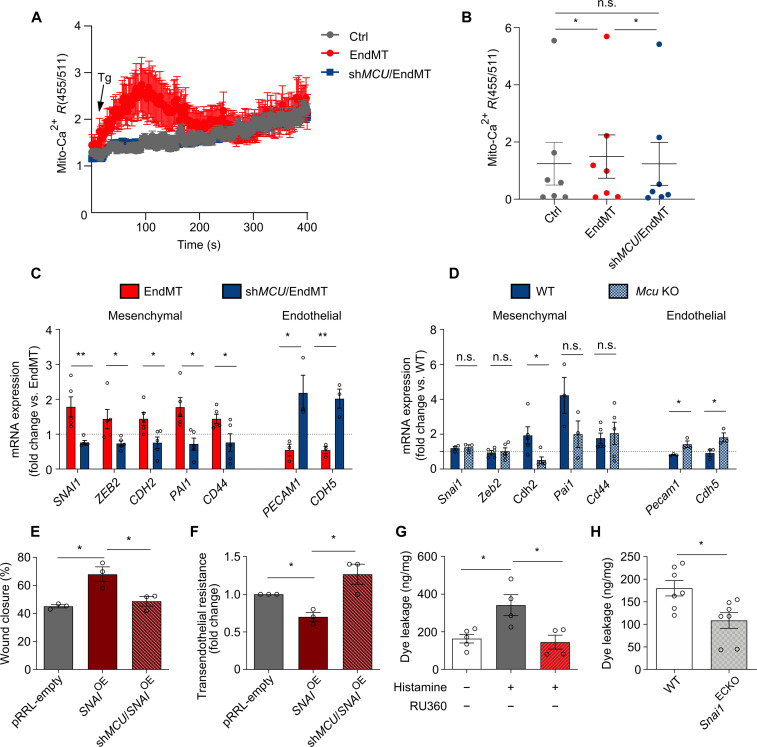
Fig. 6. MCU overexpression regulates EndMT.
(A) Mito-Ca2+ imaging traces in response to Tg (2 μM) in control HUVECs (gray trace) and EndMT-derived HUVECs (TGF-β1 stimulation) silenced or not for MCU (shMCU1) (blue and red traces, respectively) maintained in 0 mM extracellular Ca2+ solution. Traces represent the mean GECO ratio (455/511 nm) ± SEM of different cells from one representative experiment. (B) Mean peak amplitude ± SEM of Tg-mediated mito-Ca2+ uptake relative to seven independent experiments. *P < 0.05. (C) Reverse transcription polymerase chain reaction (RT-PCR) analysis of mRNA expression levels of mesenchymal and endothelial genes in control HUVECs and in HUVECs silenced for MCU before TGF-β1 stimulation. Expression values were normalized to 18S mRNA levels (n = 3 to 5). Dotted line indicates expression levels in EndMT. *P < 0.05 and **P < 0.01. (D) RT-PCR analysis of mRNA expression levels of mesenchymal and endothelial genes in wild-type (WT) and Mcu knockout (KO) ECs stimulated with TGF-β1 (n = 3 to 6). Dotted line indicates expression levels in EndMT in WT ECs. *P < 0.05. (E) Quantification of scratch wound assay using mitomycin C–treated control (empty), SNAIOE, and shMCU/SNAIOE HUVECs (n = 3). *P < 0.05. (F) Transendothelial electrical resistance analysis of control (empty), SNAIOE, and shMCU/SNAIOE HUVEC monolayers (n = 3). (G) Quantification of the Evans blue dye leakage in the ear of untreated and histamine-treated mice following vehicle or 100 μM RU360 topic application (n = 4 to 5). Values were normalized to milligrams of tissue. *P < 0.05. (H) Quantification of the Evans blue dye leakage in the ear of WT and Snai1ECKO histamine-treated mice (n = 7). Values were normalized to milligrams of tissue. *P < 0.05.

