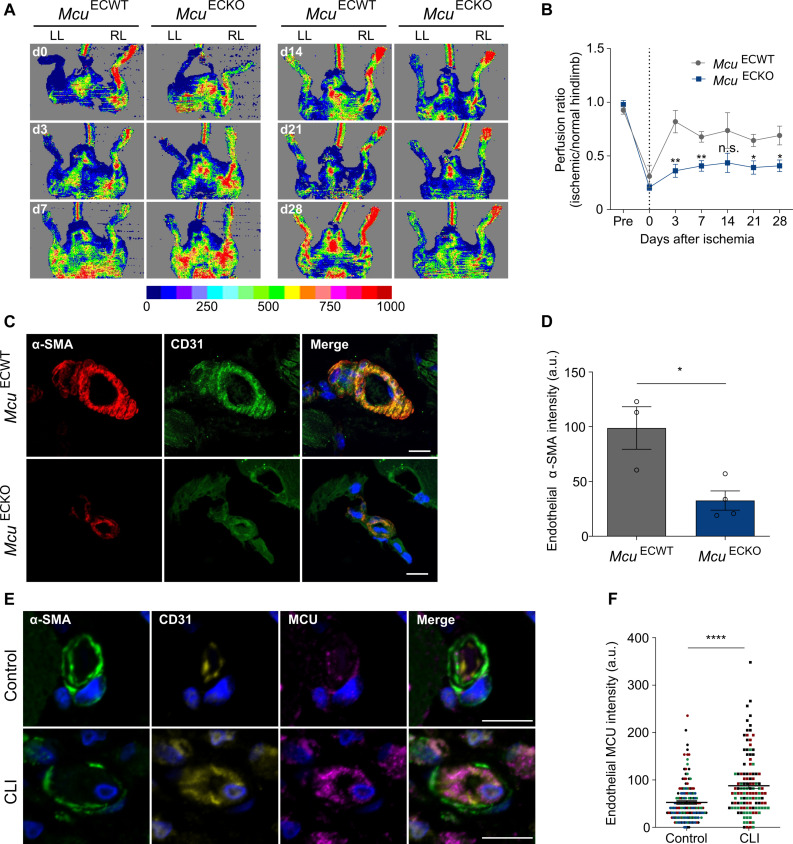
Fig. 8. Endothelial MCU regulates pathological EndMT.
(A) Representative laser Doppler images on left limb (LL) and right limb (RL) after excision of femoral artery in the left limb in McuECWT and McuECKO mice. Imaging colors from blue to red represent increased blood flow, which is defined by the color-coded heatmap. (B) Time course of mean blood flow ratios of ischemic versus normal limb measured before (pre) surgery, immediately after surgery (day 0), and days 3, 7, 14, 21, and 28 (n = 5 to 7). Dotted line indicates the day of surgery. *P < 0.05 and **P < 0.01. (C) Confocal micrographs of blood vessels from ischemic skeletal muscles of McuECWT and McuECKO mice stained for the mesenchymal marker α-SMA (red) and the endothelial marker CD31 (green). Nuclei are counterstained with DAPI (blue). Scale bars, 20 μm. (D) Quantification of α-SMA content in CD31+ vessels shown in images (n = 3 to 4). a.u., arbitrary units. *P < 0.05. (E) Confocal micrographs of small arterioles in human skeletal muscle from individuals with or without chronic limb ischemia (CLI) stained for mural cells (α-SMA; green), ECs (CD31; yellow), and MCU (purple). Nuclei are counterstained with DAPI (blue). Scale bars, 10 μm. CLI arterioles show EC thickening that markedly narrow the vessel lumen. (F) Quantification of endothelial MCU content shown in images. Data are presented as median MCU intensity and interquartile range for 160 and 120 arterioles (n = 4 control individuals and n = 3 individuals with CLI). Colors correspond to each individual. ****P < 0.0001.

