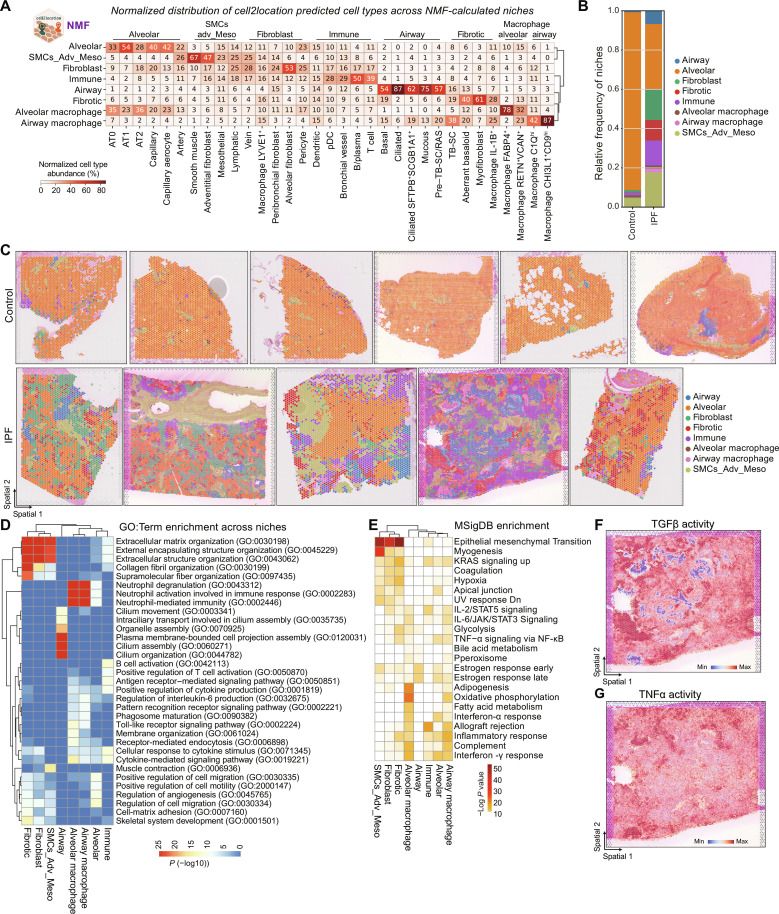
Fig. 2. Identification of three characteristic cellular niches in IPF lung tissue.
(A) Heatmap shows the normalized distribution of estimated cell type abundance in percentages across the niches, which were computed using the NMF method of the cell2location package. SMCs_Adv_Meso refers to smooth muscle, adventitial fibroblast, and mesothelial cells. (B) Relative frequency of niches across disease conditions is shown. Values are aggregated for four control and three IPF donors. (C) Spatial plots visualize the niche annotation across all samples and across conditions. (D) The heatmap shows top 3 enriched GO: terms per niche, colored by–log10 P value. (E) The heatmap shows top enriched Molecular Signatures Database (MSigDB) hallmark genes sets per niche. UV, ultraviolet; STAT5, signal transducers and activators of transcription 5; JAK, Janus kinase; NF-κB, nuclear factor κB; KRAS, Kirsten rat sarcoma virus; Dn, down-regulated. (F and G) Spatial plots exemplary show pathway activity for one IPF section.

