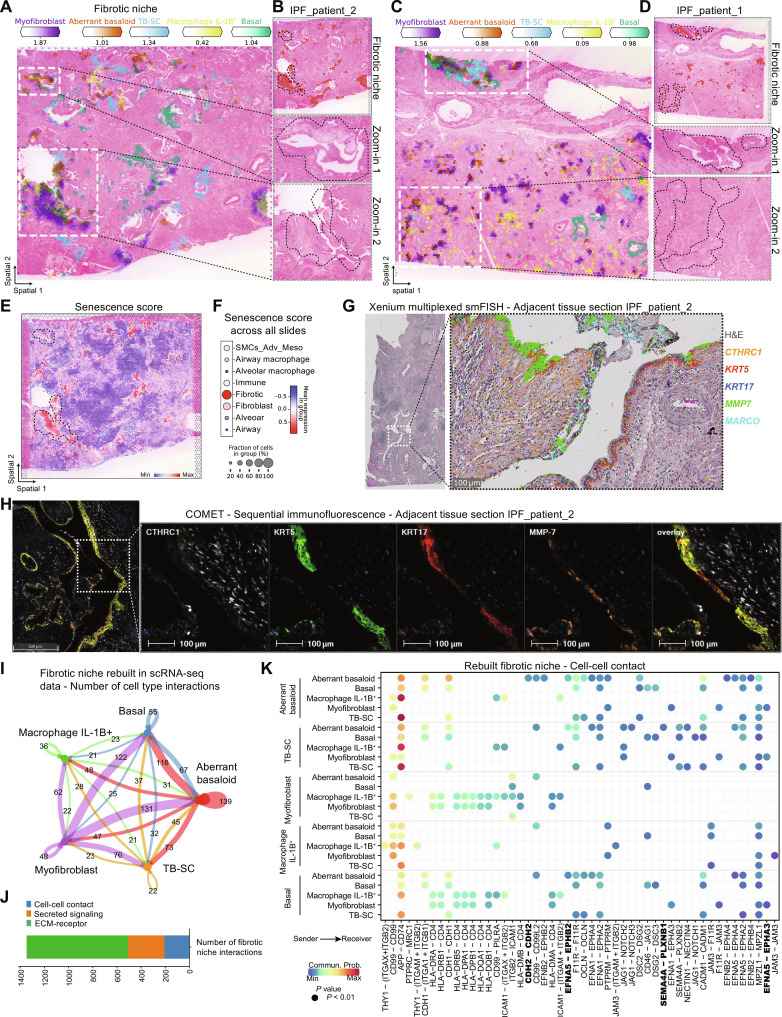
Fig. 3. The fibrotic niche localizes around airways.
(A to D) Spatial plots show, for two IPF tissue sections, (A and C) the abundance of fibrotic niche–associated cell types and (B and D) the fibrotic niche distribution and zoom into H&E-stained tissue for highlighted regions. (E and F) Senescence gene score (CDKN1A, CDKN1B, CDKN2B, TP53, SERPINE1, and GLB1) calculated using hotspot gene-module scoring (29) (E) on one IPF tissue section and (F) as dot plot against the other niches. (G) Xenium mRNA in situ hybridization data on an adjacent tissue section from (A). (H) Multiplexed protein immunofluorescence on an adjacent tissue section from (A). (I) Bubble plot summarizing the number of interactions within the rebuilt fibrotic niche in the scRNA-seq PF-ILD atlas data. (J) Number of interactions within the fibrotic niche per communication category. (K) Heatmap of statistically significant ligand-receptor pairs from the cell-cell contact category within the fibrotic niche.

