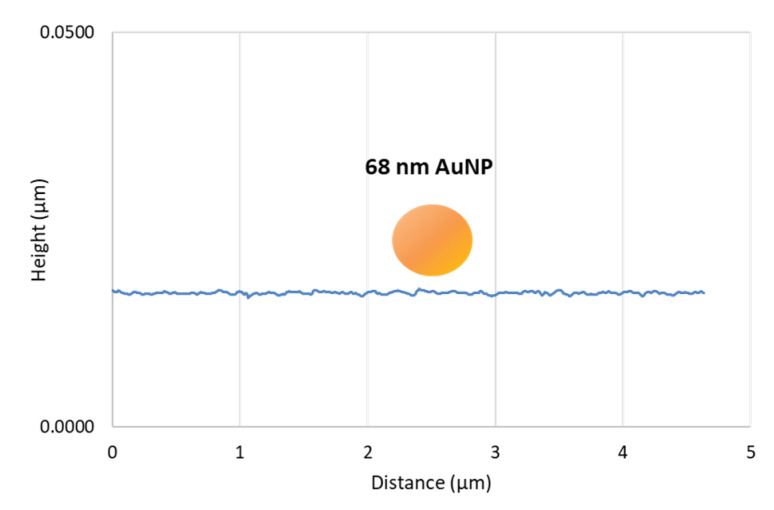
Figure 6.
This 2D plot, meticulously constructed using Gwyddion software, is a crucial visual aid in our study. It provides a scaled representation of the MePPOx substrate’s roughness and the complex field HHCF. A visual representation of the 68 nm AuNP is included, which is crucial for understanding AuNP’s behaviour on the MePPOx substrate. The Set Point value was 40 nN.

