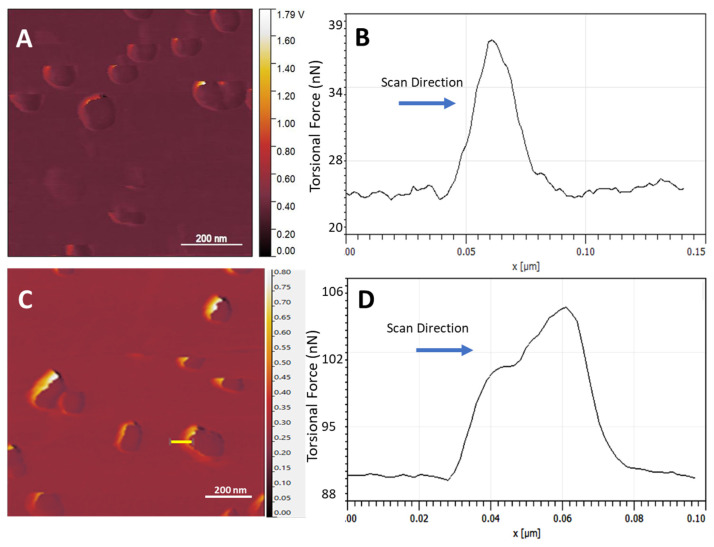
Figure 7.
(A) Lateral deflection trace scan at a 10 nN Set Point (the yellow line indicates the site where plot (B) was executed), (B) 2D plot over an individual AuNP, (C) lateral deflection trace scan at a 20 nN Set Point (the yellow line indicates the site where plot (D) was executed), (D) 2D plot over an individual AuNP displaying the double climbing effect.

