Table 2.
Activity of fluoroquinolone complexes.
| The Structure of the Complex | Cell Line or DNA/Activity | Ref. | |
|---|---|---|---|
| 6 |
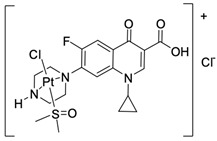
|
MCF-7/17.3 µM MDA-MB-231/15.3 µM |
[42] |
| 7 |
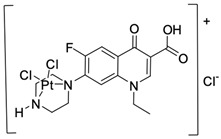
|
BF16-F10/27 µM | [43] |
| 8 |
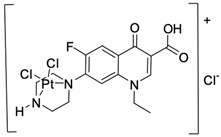
|
BF16-F10/29 µM | [43] |
| 9 |
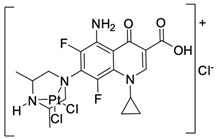
|
BF16-F10/45 µM | [43] |
| 10 |
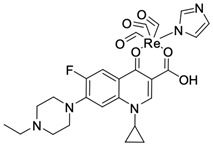
|
K-562/13.12 µM | [44,45] |
| 11 |
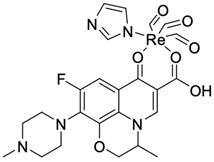
|
K-562/19.99 µM | [45] |
| 12 |
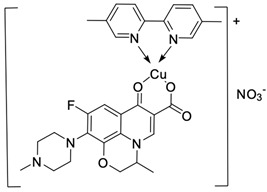
|
A498/GI50 < 10 | [46] |
| 13 |
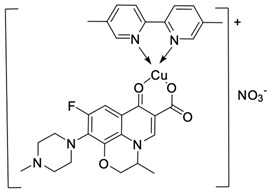
|
MCF-7/1.04 µM | [48] |
| 14 |
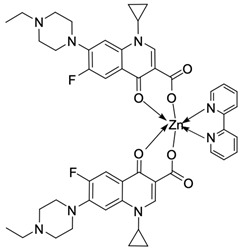
|
Ct DNA/Kb = 2.61 × 10⁶ M−1 | [49] |
| 15 |
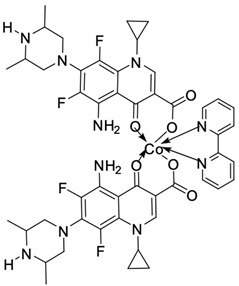
|
Ct DNA/Kb = 1.38 × 10⁶ M−1 | [50] |
| 16 |
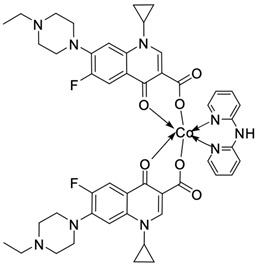
|
Ct DNA/Kb = 3.39 × 10⁶ M−1 | [51] |
| 17 |
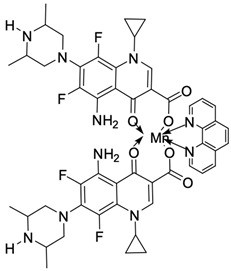
|
Ct DNA/Kb = 1.01 × 10⁶ M−1 | [52] |
| 18 |
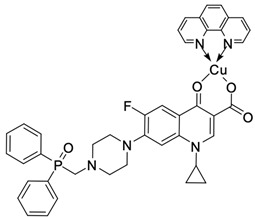
|
A549/8.3 µM CT26/7.3 µM |
[53] |
| 19 |
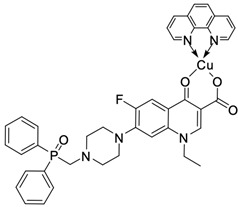
|
A549/15.9 µM CT26/8.4 µM |
[53] |
| 20 |
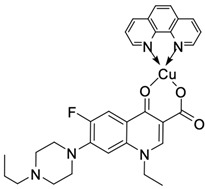
|
HL-60/induces apoptosis in 57.59% at concentration 100 µg × mL−1 | [54] |
| 21 |
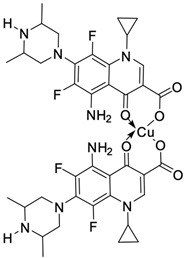
|
BT20/12 µM | [55] |
| 22 |
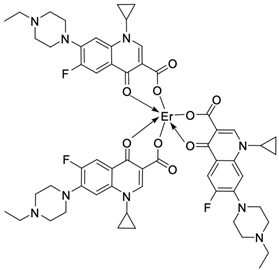
|
Ct DNA/Kb = 4.24 × 10⁶ M−1 | [56] |
