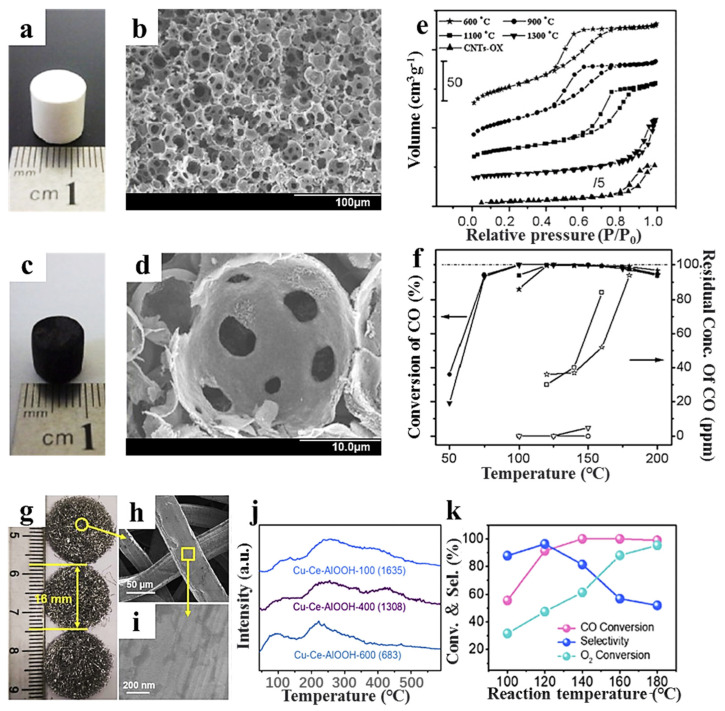
Figure 4.
Photographs and SEM images of (a,b) macro-mesoporous hierarchical Al2O3 and (c,d) hierarchical CNT-Al2O3 [44]; (e) BJH pore size distribution curves of the hierarchical CNT-Al2O3 monolith calcined at different temperatures [44]; (f) reaction temperature dependence of CO conversion (filled symbol) and residual concentration of CO (open symbol) for the Pt-Ni/CNT-Al2O3 monolithic catalyst [44]; (g) photographs and (h,i) SEM image of pure Al-fiber [49]; (j) TPD of a CuO-CeO2/AlOOH/Al fiber monolithic catalyst calcined at different temperatures. The values in brackets are the areas of the second peak (180-580 °C) [49]; (k) CO-PROX catalytic performance of the CuO-CeO2/AlOOH/Al-100 fiber monolithic catalyst [49].

