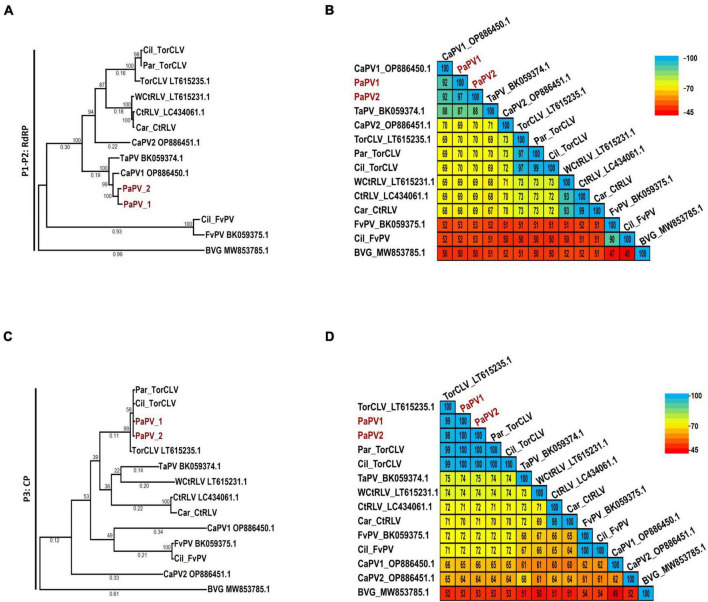
FIGURE 4.
Phylogenetic trees and average percent pairwise matrices depicting relationships of the polerovirus sequences found in this study. Depicted are maximum likelihood phylogenetic trees (A and C) and pairwise identity matrices (B and D) constructed using the translated amino acid sequences of the (A and C) P1-P2 (RdRp) and the (C and D) P3 (CP) genes of the poleroviruses identified in this study. Labels to the left of the figures indicate the amino acid sequences used for comparison. Numbers below the tree branches indicate the amino acid substitutions per site, and numbers above indicate the bootstrap support values; bootstrap values below 50% are not shown (trees were calculated using 1000 bootstrap replicates). Species demarcation is > 10% difference in aa identity of any protein. Isolates of the putative new recombinant polerovirus identified in this study, PaPV, are highlighted in red. References sequences are indicated by their GenBank accession numbers to the right of the virus label; accession numbers for the viruses identified in this study are listed in Table 4. Par_ and Car_ indicate the sequences were retrieved from parsley and carrot samples, respectively. The scales to the right indicate the percent identity scores displayed in the matrix. TaPV, Trachyspermum ammi polerovirus; TorCLV, Torilis crimson leaf virus; CtRLV, carrot red leaf virus; PaPV, parsley polerovirus; FvPV, Foeniculum vulgare polerovirus; WCtRLV, wild carrot red leaf virus; BVG, barley virus G (outgroup).

