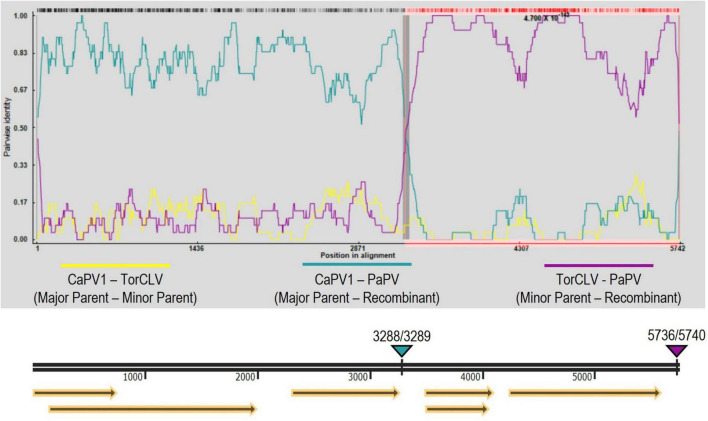
FIGURE 5.
Recombination analysis of the putative new recombinant polerovirus PaPV. RDP analysis of CaPV1, TorCLV, and PaPV viral sequences. Yellow lines indicate pairwise nt comparisons across the entire length of the genomes of CaPV1 and TorCLV, teal lines indicate pairwise comparisons between CaPV1 and PaPV1, and magenta lines indicate pairwise comparisons between TorCLV and PaPV. The double black line beneath the recombination graph indicates the nt positions in the viral genome, yellow arrows beneath this line indicate the predicted reading frames, and the teal and magenta triangles above the line indicate the nt positions of the beginning and ending breakpoints in the viral genome. Average P-values for each of the recombination analysis methods performed by the RPD4 software are listed in Supplementary Table 4.

