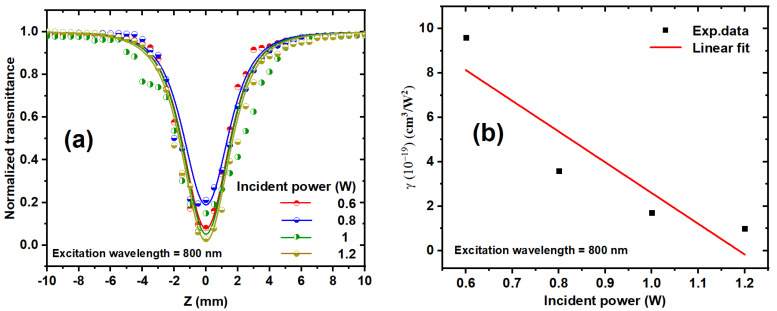
Figure 9.
(a) OA z-scan transmission for Ag/Au alloy colloids at various incident powers and at an 800 nm excitation wavelength. The dots correspond to the experimental data, and the solid curves represent the fits obtained utilizing Equation (1). (b) Relationship between the incident power and the obtained values of γ for the Ag–Au colloidal solution at an 800 nm excitation wavelength. The dots indicate the experimental data, while the solid line represents a linear fit.

