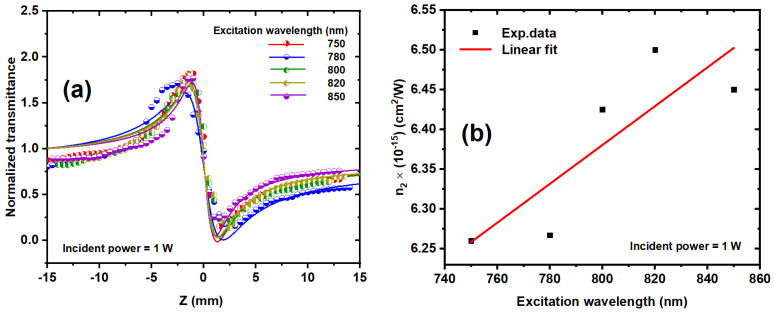
Figure 12.
(a) CA z-scan measurements for Ag/Au alloy colloids at various excitation wavelengths from 750 to 850 and a 1 W incident power. The solid curves were theoretically fitted using Equations (2) and (3). (b) The nonlinear refractive index of the Ag/Au colloid as a function of the excitation wavelength. The dots are the experimental results, and the solid line is the linear fit.

