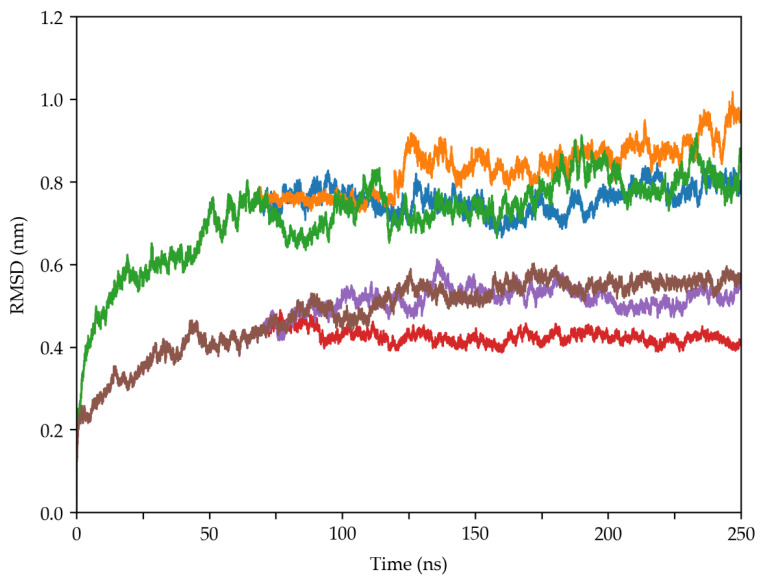
Figure 4.
Time evolution of RMSD values of the 16S RNA molecules in the two systems as a function of time. The blue, orange, and green lines indicate the three MD replicas simulated without trehalose, while the red, violet, and brown lines indicate those simulated in the presence of trehalose molecules.

