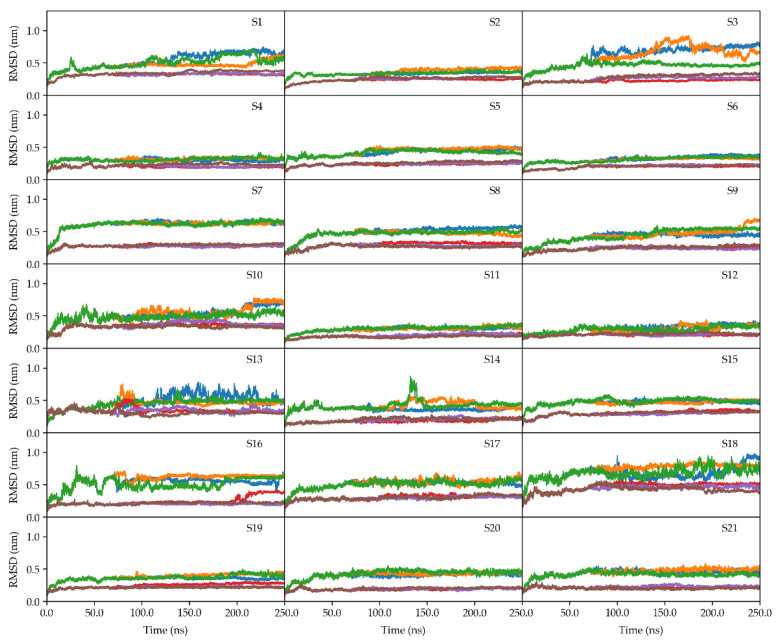
Figure 5.
RMSD values as a function of time for the 21 proteins of the 30S subunit in the two systems, indicated as S1–S21, as a function of time. The blue, orange, and green lines indicate the three MD replicas simulated without trehalose, while the red, violet, and brown lines indicate those simulated in the presence of trehalose molecules.

