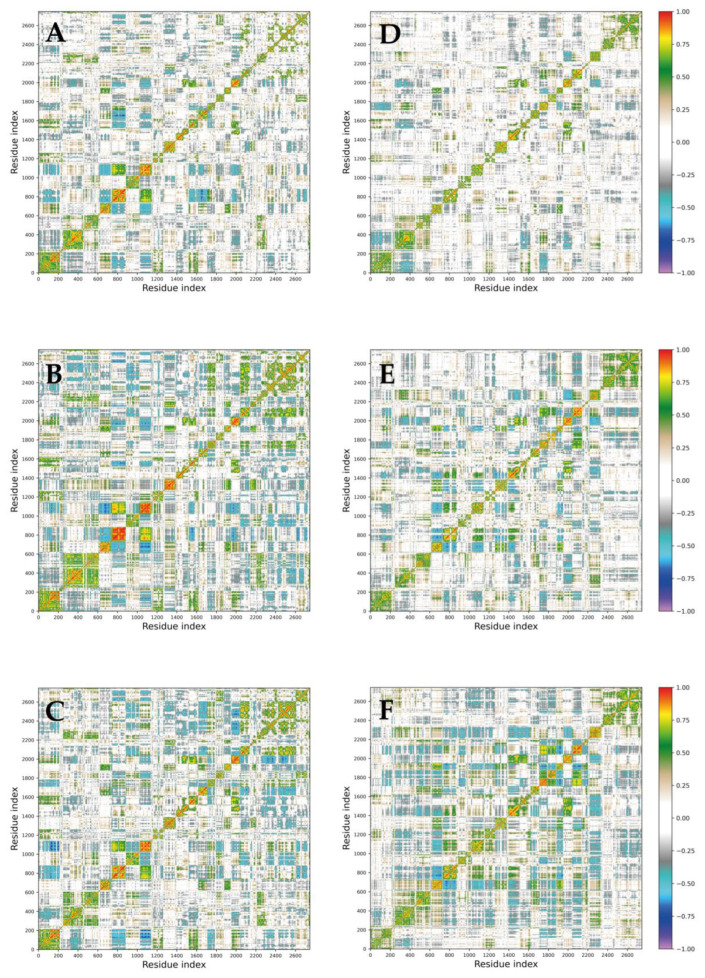
Figure 7.
DCCMs obtained from the covariance matrices of the 30S subunits. The (A–C) panels represent the DCCM calculated on Cα atoms for the three replicas simulated without sugar molecules, while the (D–F) panels represent the DCCMs calculated for the replicas simulated with trehalose. Colour coding is reported in the legend.

