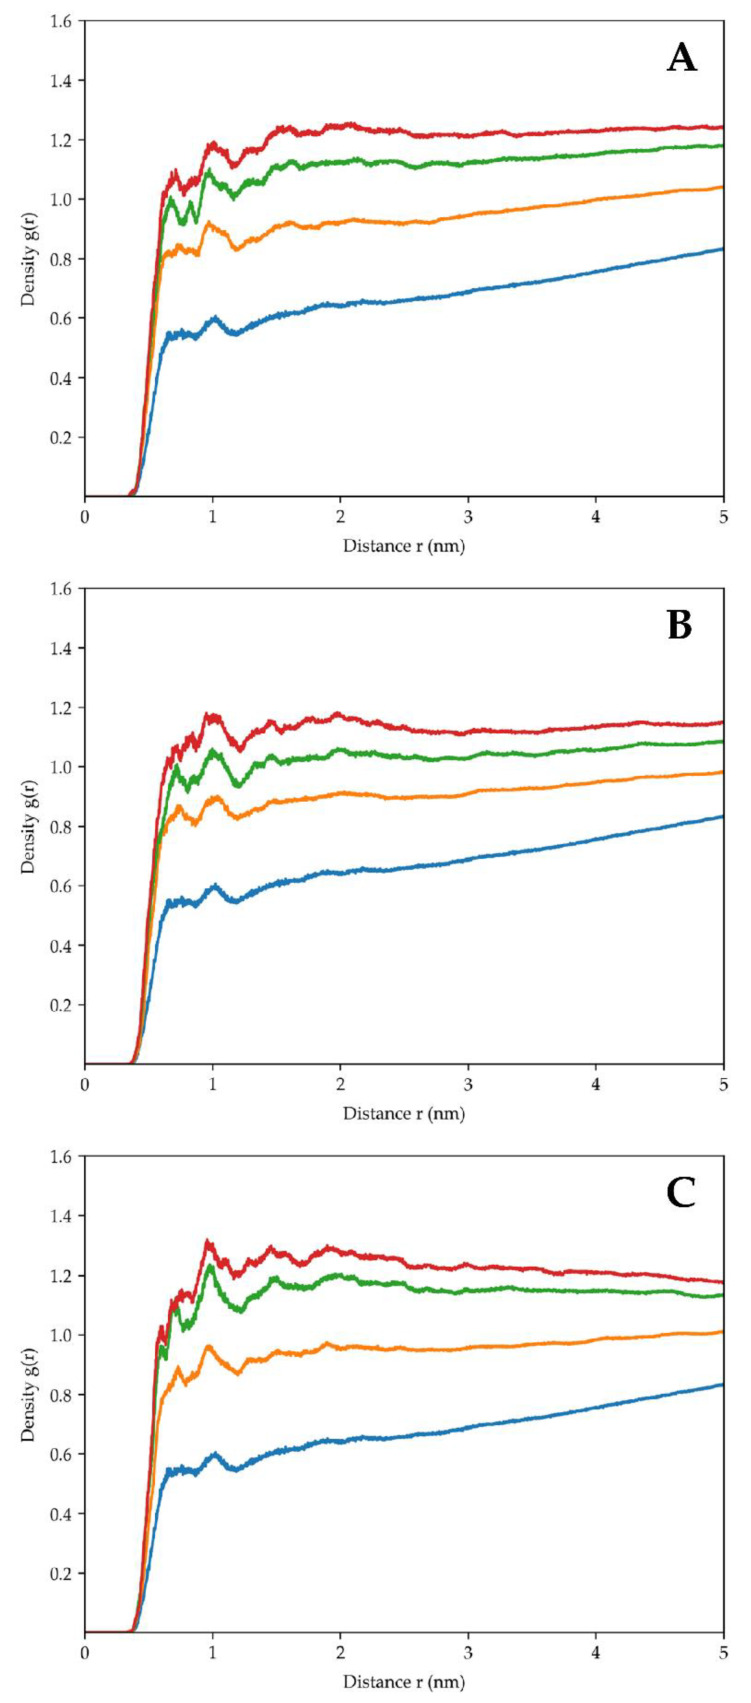
Figure 9.
The radial distribution function of trehalose indicates that the density of the sugar, concerning the ribosome surface, increases over time. Each function was calculated in a different and progressive simulation time window. The values increase from the blue (50–100 ns) to the red (200–250 ns) line. The (A–C) panels depict trehalose’s behaviour in the three simulation replicas.

