Figure 1.
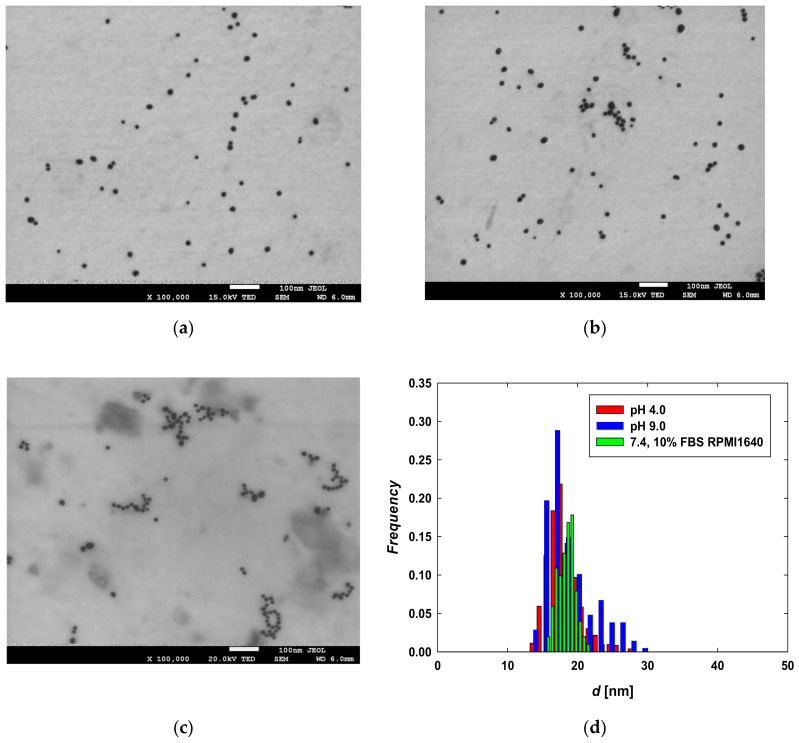
TEM micrographs of CYS-AgNPs dispersed in aqueous suspensions of (a) pH 4.0, (b) pH 9.0, and (c) in full RPMI medium supplemented by 10% FBS of pH 7.4; (d) size distribution of CYS-AgNPs after 24 h of incubation in pH 4.0 (red bars), pH 9.0 (blue bars) and 10% FBS RPMI 1640 medium (green bars). The histogram was constructed by analyzing the surface areas and diameters of 1000 CYS-AgNPs from the TEM micrographs.

