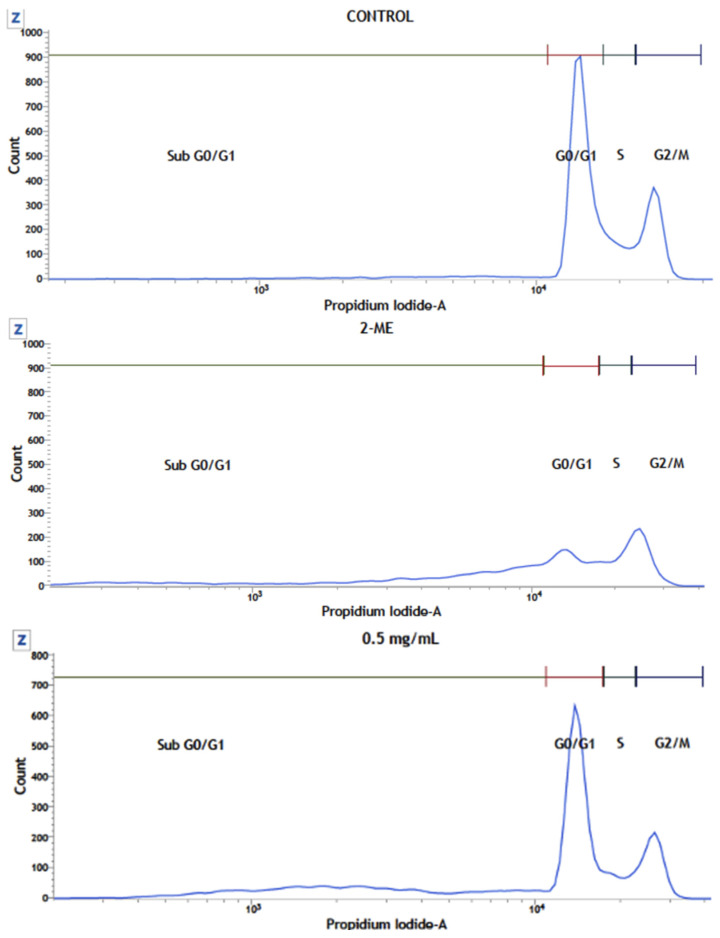
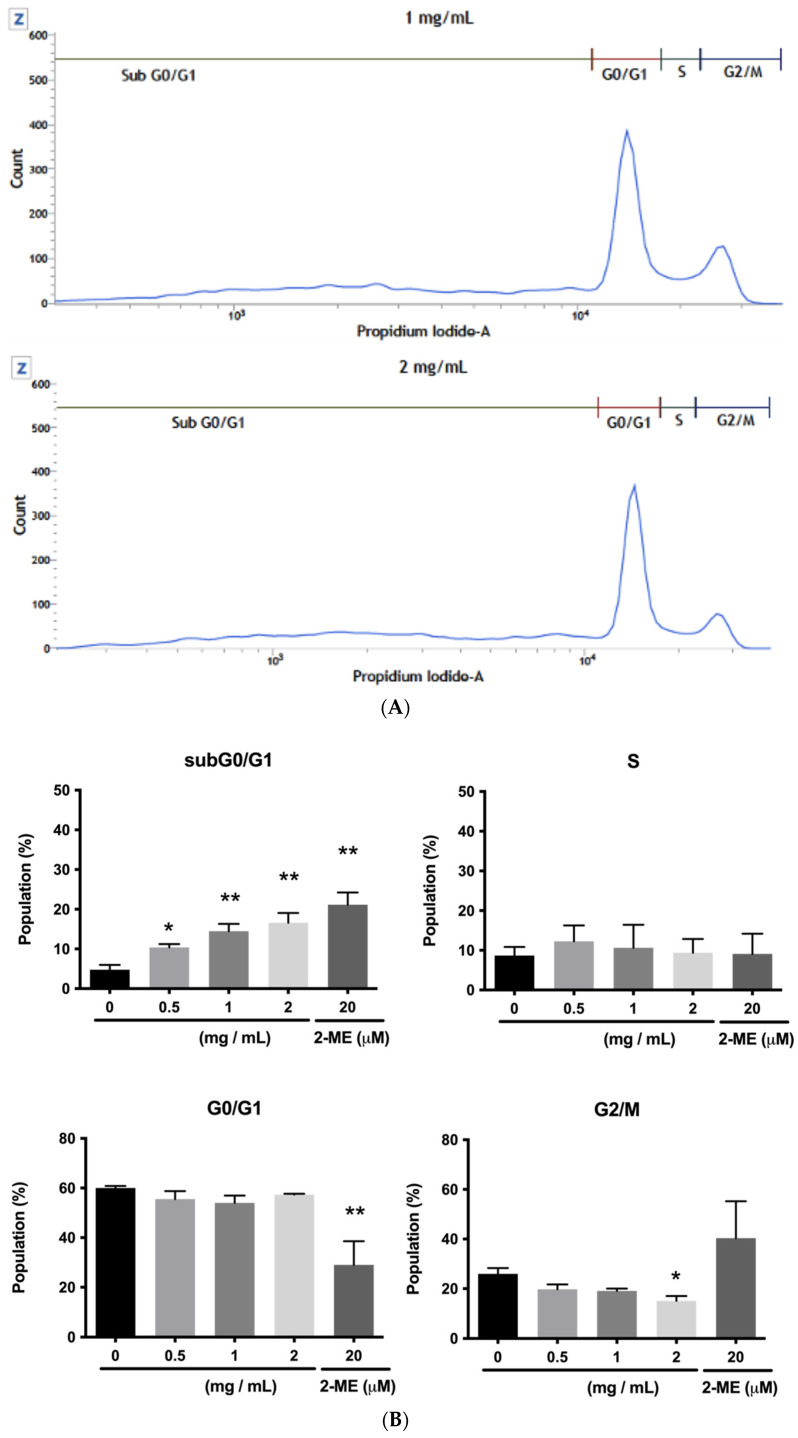
Figure 6.
Effect of FcPs on the HCT166 Cell Cycle. (A) Representative cell cycle histograms for HCT166 control conditions or treated with the polysaccharide at the pointed concentrations, measured after 16 h using propidium iodide staining and flow cytometry. (B) The quantitative analysis for the four cell cycle subpopulations in control and treated conditions. Data are means ± S.D. of at least three independent experiments (* p < 0.05, ** p < 0.01).


