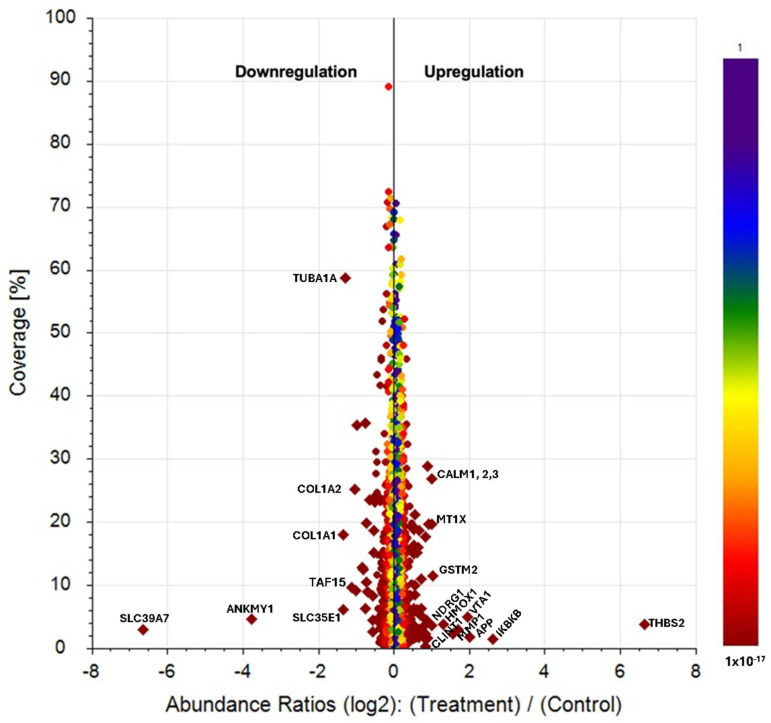
Figure 7.
Scatter plots showing the percentage of protein sequence coverage vs. their Log2 fold change abundance value in HGF cells after 24 h with FcPs. Proteins were ranked according to their p-value from red to blue color. Proteins with p-value < 0.05 and Log2 fold change < −0.5 or >0.5 are drawn in diamonds (only gene symbols with fold change < 0.5 or >2 are shown).

