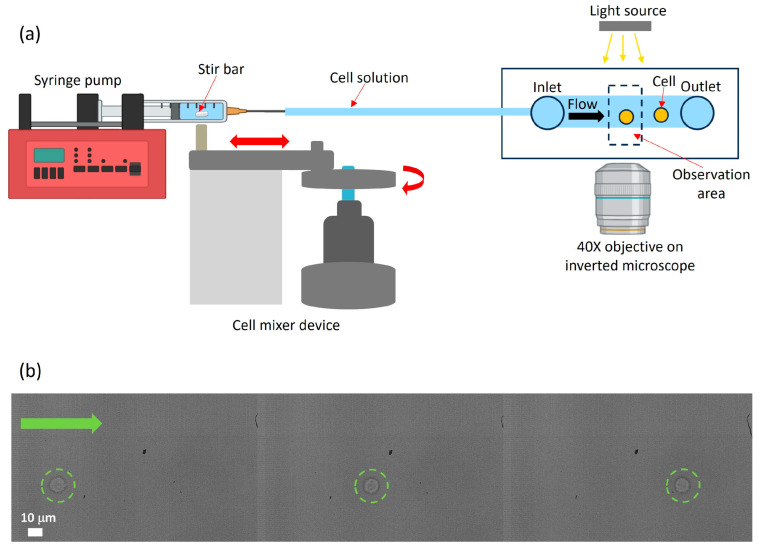
Figure 3.
(a) Scheme of the experimental setup used for cell counting experiments. Black arrow indicates the flow direction inside the microchannel. (b) Image sequence of a cell (highlighted by green dotted circles) flowing within the microchannel from left to right; the green arrow indicates the flow direction.

