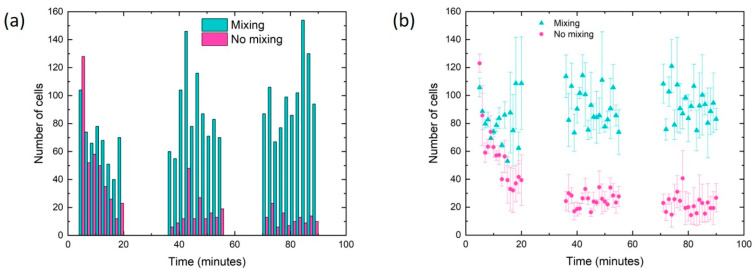
Figure 7.
(a) Histogram showing the number of cells counted for each image sequence over 90 min of experiment, under both mixing and no mixing conditions for one specific experiment (n = 1). (b) Averaged data of cell number as a function of time, collected from experiments performed on different days (n = 3). In all experiments, the oscillation frequency is set to 0.72 Hz and the cell concentration is 2 × 10⁵ cells/mL.

