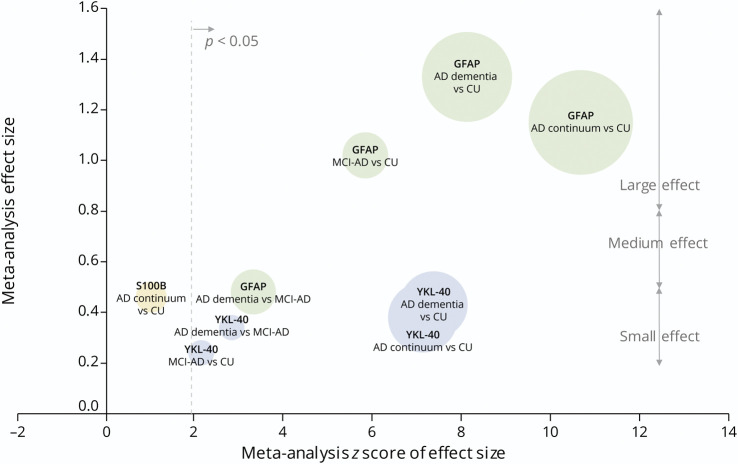
Figure 6. Bubble Plot: Results of All Meta-analyses of Blood Astrocyte Biomarkers Across the AD Continuum.
The effect size of each meta-analysis is plotted against the z score. A z score of 1.96 is equivalent to p = 0.05. Circle size reflects the total number of participants in the meta-analysis. Raw data are available in eTable 5. AD = Alzheimer disease; AD continuum = cohorts comprising MCI-AD, AD dementia, or a combination of both; CU = cognitively unimpaired; GFAP = glial fibrillary acidic protein; MCI-AD = mild cognitive impairment due to Alzheimer disease.

