
Figure 3.
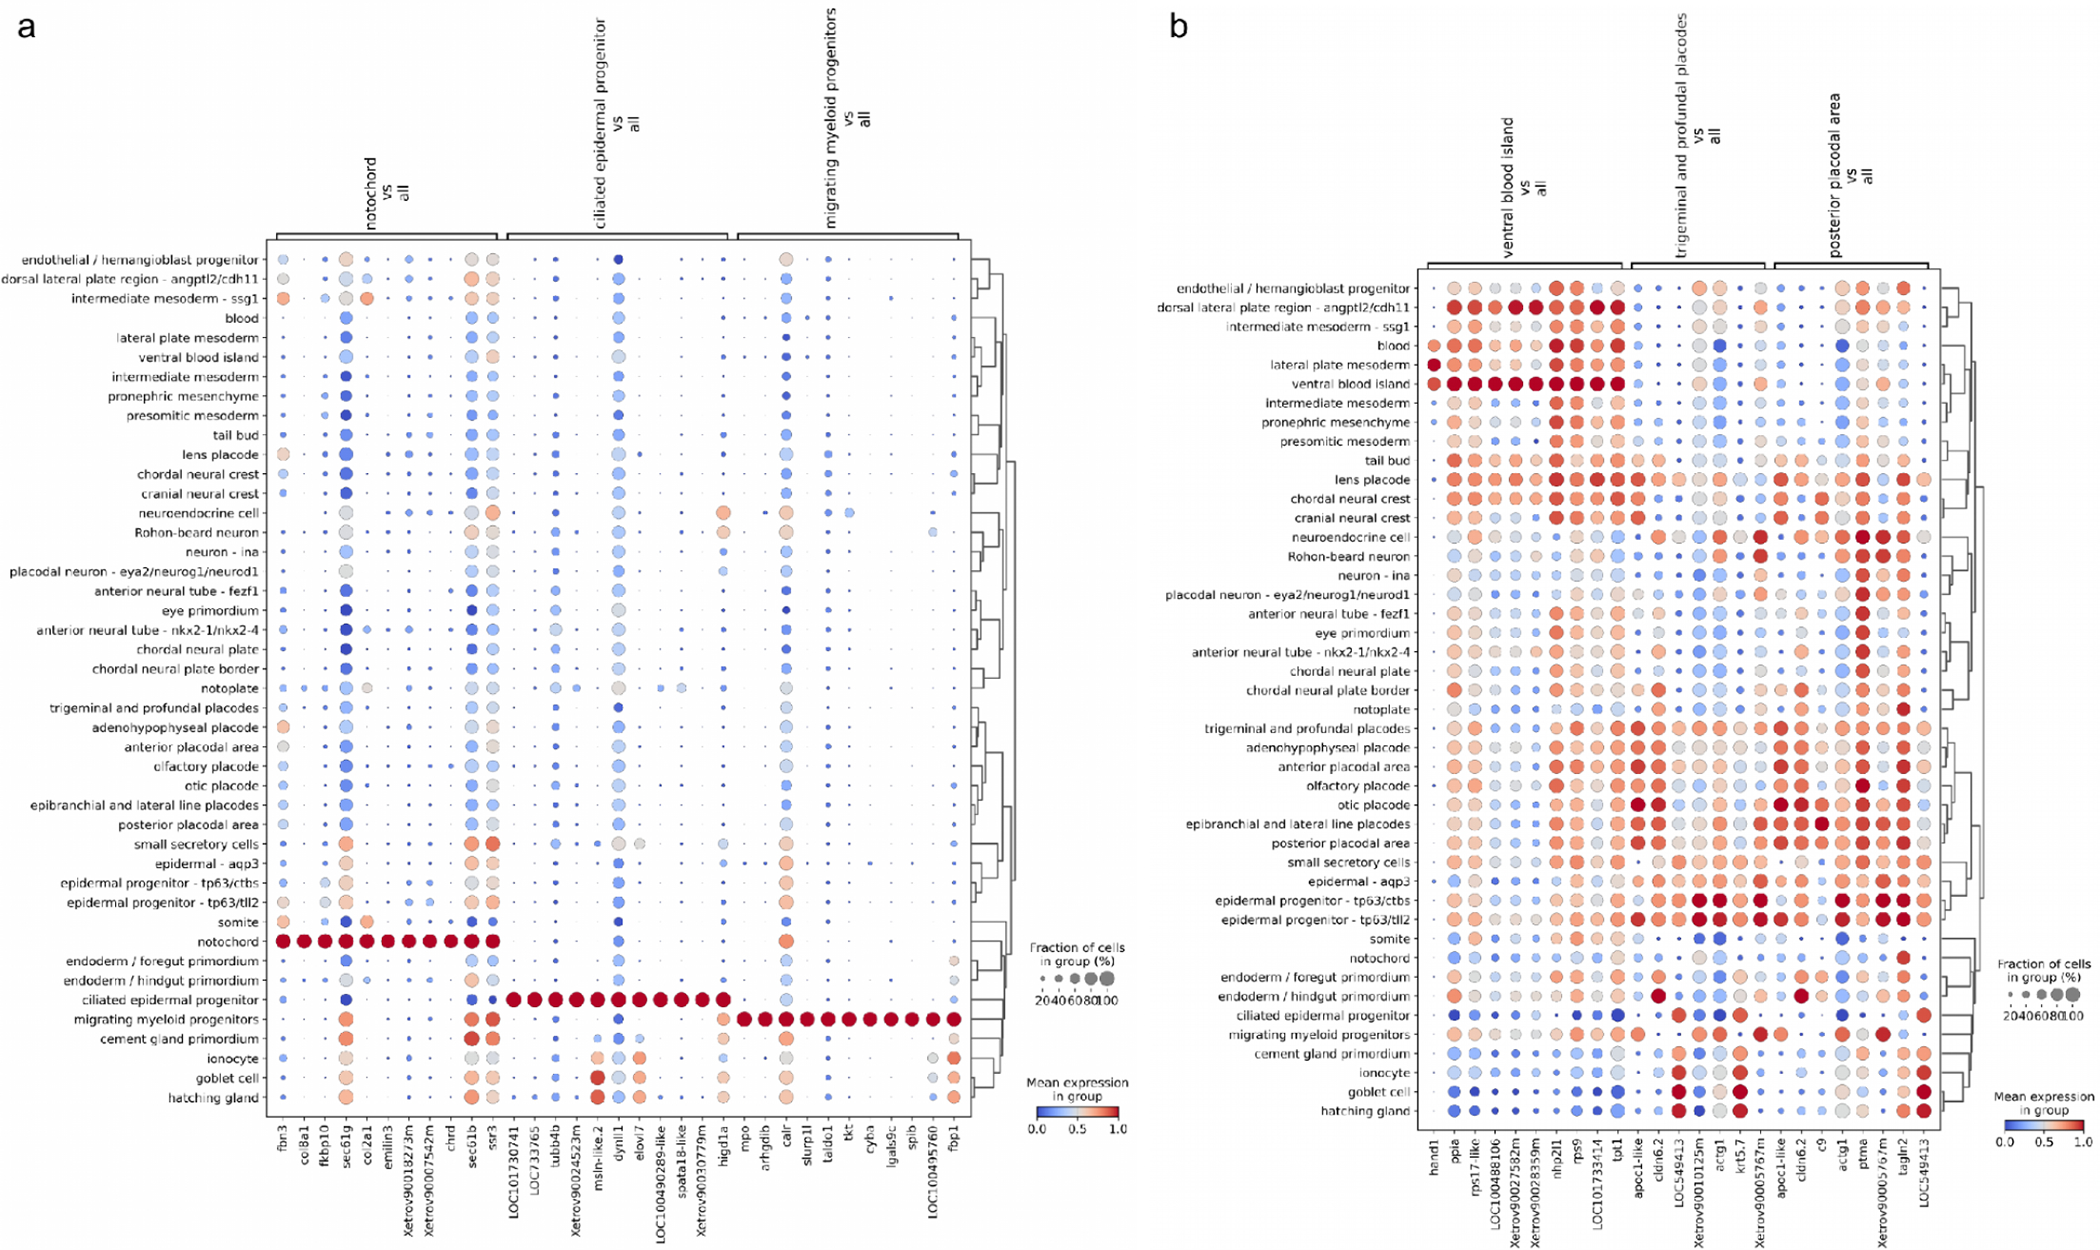
Dotplot of normalized counts for stage NF18. (a) The top 10 differentially expressed upregulated genes for the best predictable cell types. (b) The top 10 differentially expressed upregulated genes for poorly predictable cell types.
Official websites use .gov
A
.gov website belongs to an official
government organization in the United States.
Secure .gov websites use HTTPS
A lock (
) or https:// means you've safely
connected to the .gov website. Share sensitive
information only on official, secure websites.
Dotplot of normalized counts for stage NF18. (a) The top 10 differentially expressed upregulated genes for the best predictable cell types. (b) The top 10 differentially expressed upregulated genes for poorly predictable cell types.