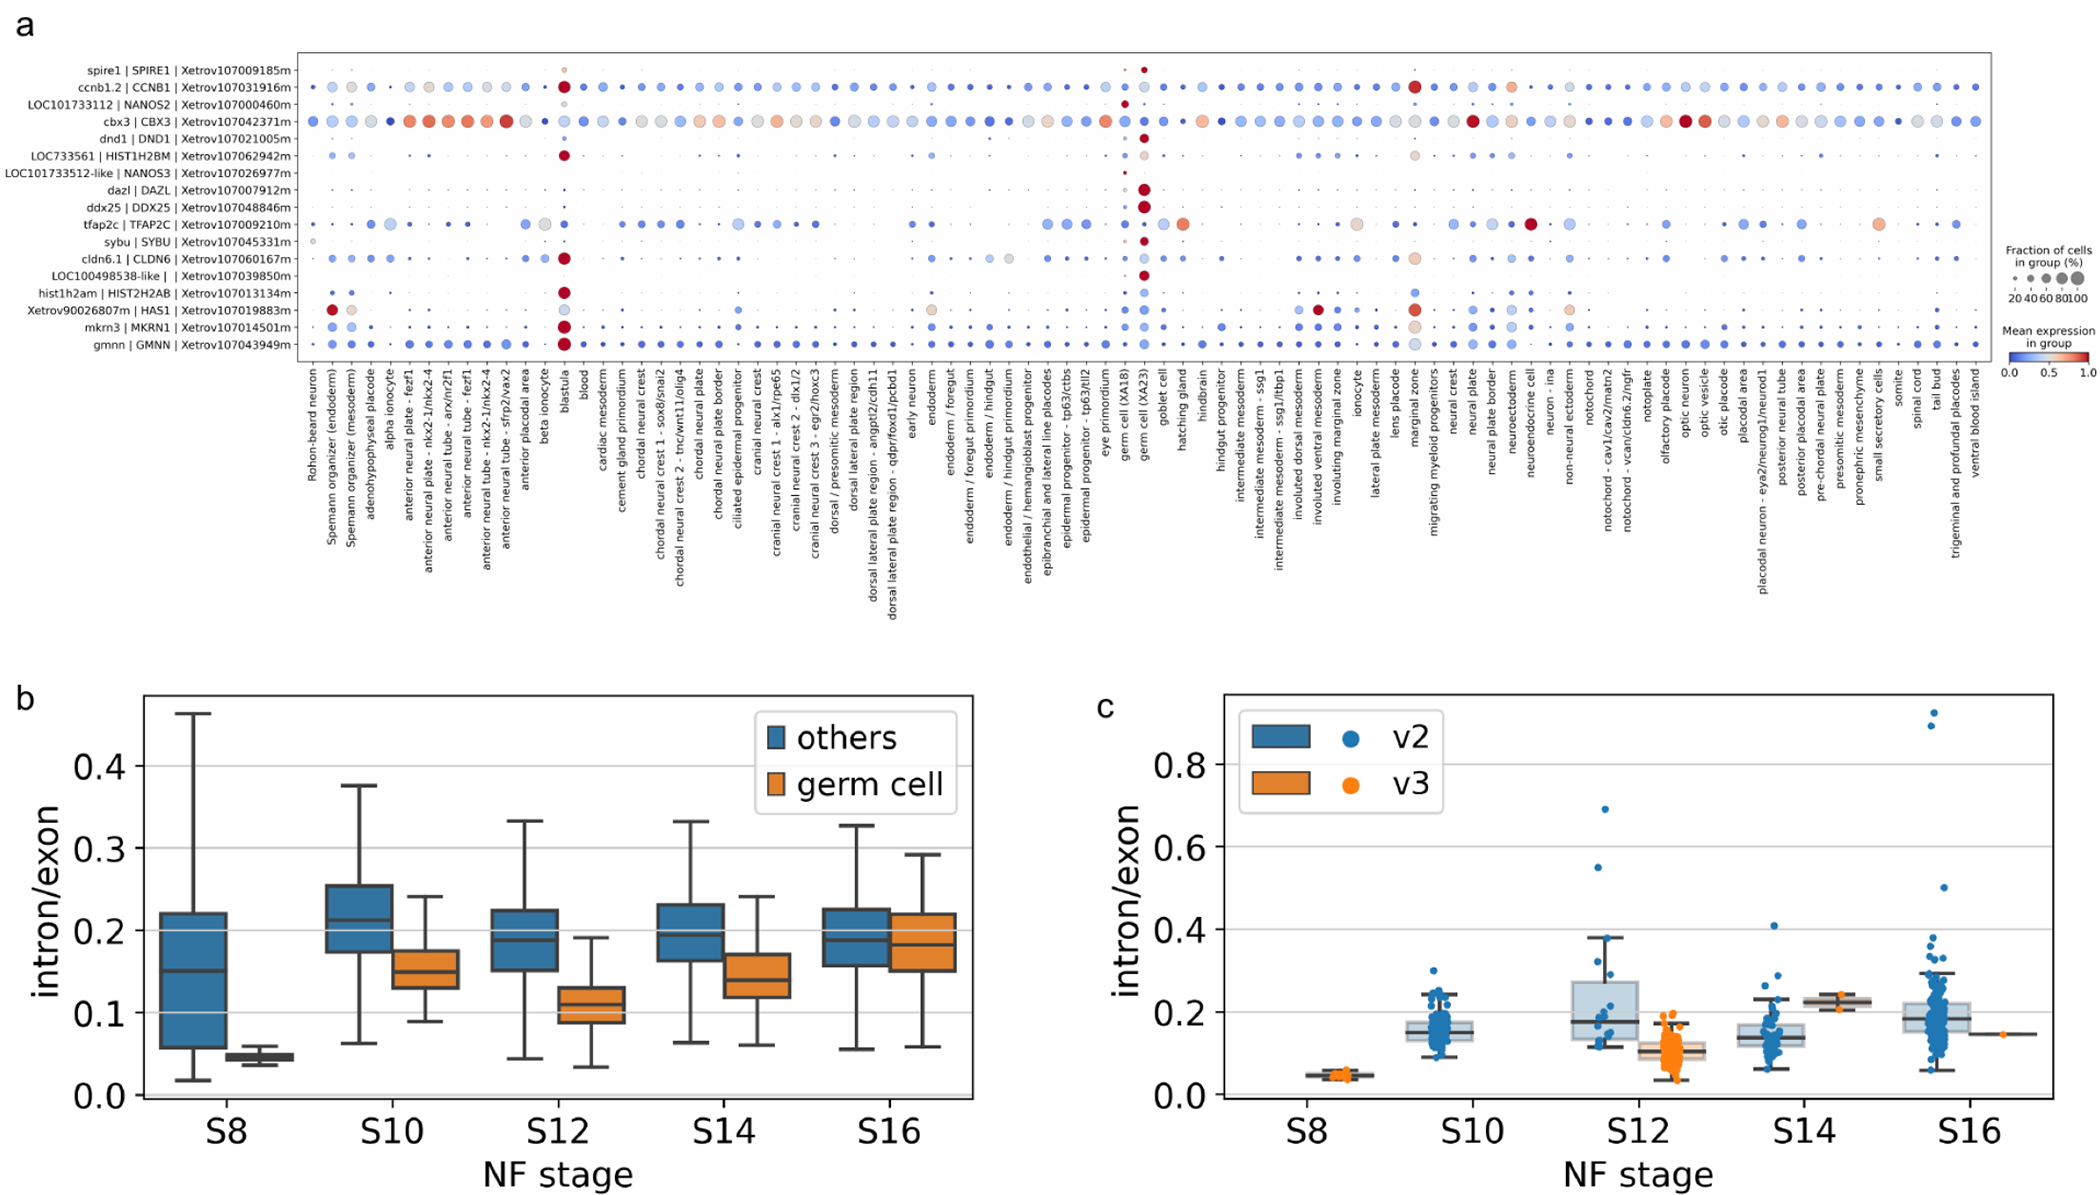
Figure 6.

Dotplot of top upregulated differentially expressed genes in germ cells annotated in XA18 and XA23, all stages analyzed jointly (a), boxplot of intron/exon counts ratio for germ cells versus other cell types at the stages observed (b) and intron/exon ratio for germ cells at the stages observed separately by inDrops version (c).
