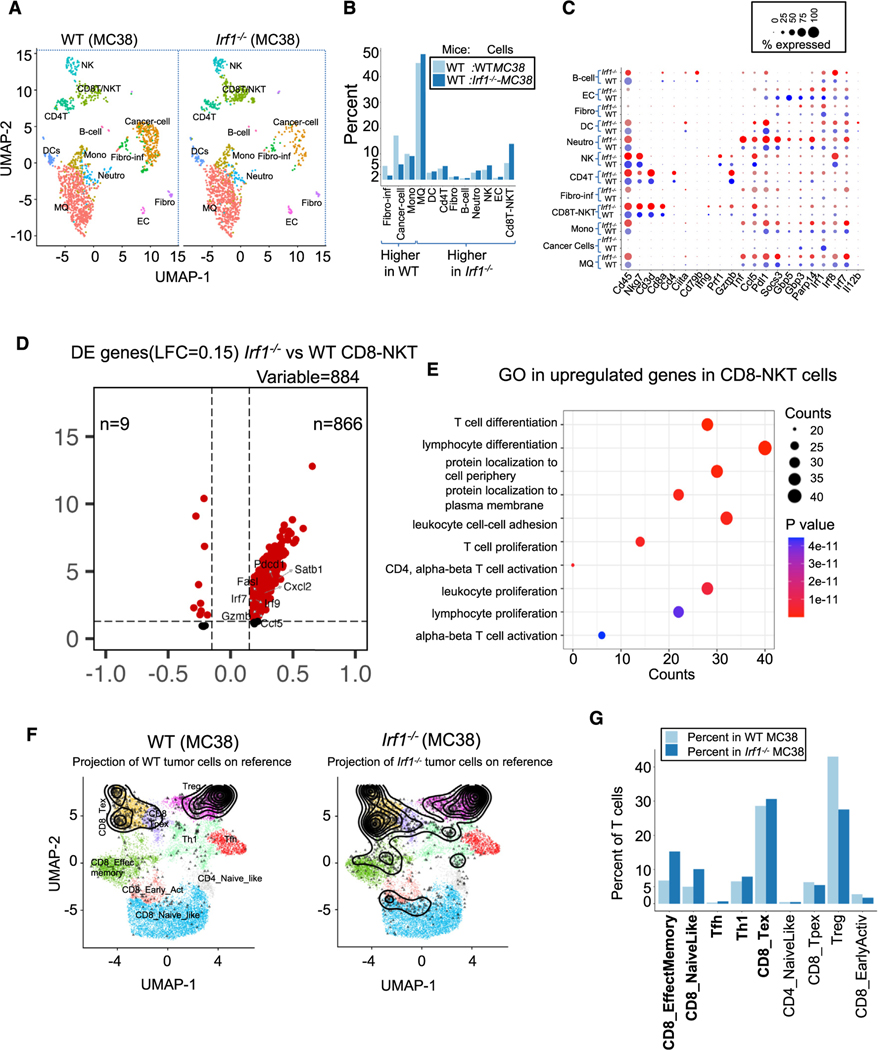
Figure 3. Enhanced effector T cell response in Irf1−/− tumors.
(A) UMAP showing 12 distinct cell populations in WT and Irf1−/− tumors.
(B) Percentage of indicated cell populations in WT and Irf1−/− tumors.
(C) Dot plot showing expression of select cell-type-specific and immune activation genes in cells from WT and Irf1−/− tumors.
(D) Differential expression (DE) of genes enriched in the CD8-NKT cell cluster.
(E) Gene Ontology analysis of cells in the CD8-NKT cluster from Irf1−/− tumors.
(F) Projection of T cells (black profile) from WT and Irf1−/− tumor scRNA-seq onto reference T cell atlas (colored distinct T cell states) from ProjectTILs.
(G) Proportion of various T cell states in WT and Irf1−/− tumors as defined by the reference T cell atlas. All data were generated by comparison of scRNA-seq data pooled from 4 WT and 6 Irf1−/− mouse tumors.

