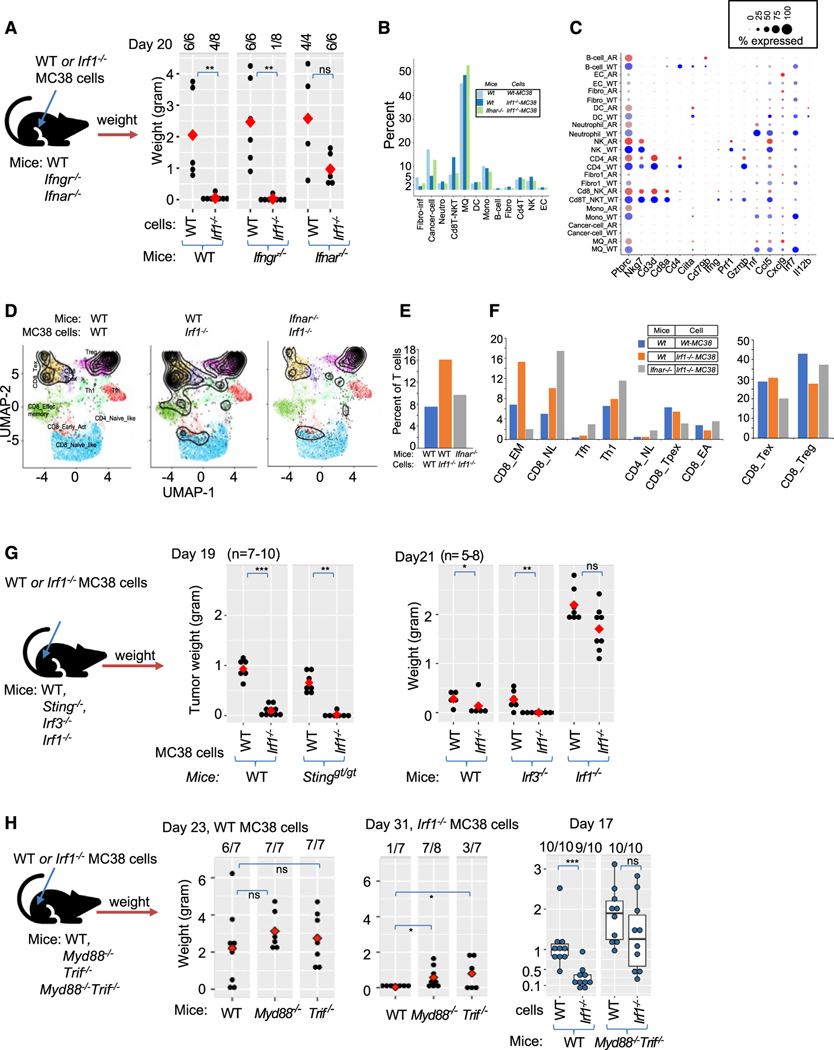
Figure 4. Responsiveness to type I but not the type II interferon (IFN-γ) mediates Irf1−/− tumor control.
(A) Experimental design (left) for test the role of host IFN-I and IFN-II in WT and Irf1−/− MC38 tumors. Right dot plot represents weight of WT and Irf1−/− MC38 tumors from mice on day 20.
(B) Proportion of indicated cell populations among WT MC38 tumor grown in WT mice and Irf1−/− MC38 tumor grown in WT or Ifnar−/− mice.
(C) Dot plot showing expression of activation markers and ISGs in distinct cell types from Irf1−/− MC38 tumor grown in WT or Ifnar−/− mice.
(D) Projection of scRNA-seq data of T cells (black profile) from indicated tumors onto reference T cell atlas (colored distinct T cell states) from ProjectTILs.
(E) Percentage of T cells mapped to reference T cell states in the scRNA-seq data from indicated tumors.
(F) Proportion of various T cell states in the scRNA-seq data from the indicated tumors.
(G) Left side shows the experimental scheme of upcoming experimental testing. Middle boxplot shows weight of WT and Irf1−/− MC38 tumor from WT and Stinggt/gt mice, and right boxplot shows weight of WT and Irf1−/− tumors in indicated mice.
(H) Left side shows scheme of testing host TLR pathways in Irf1−/− tumors. First two dot plot panels show weight of WT (1st dot plot, day 23) and Irf1−/− (2nd dot plot, day 31) MC38 tumors in WT, Myd88−/−, and Trif−/− mice. Last boxplot shows weight of WT and Irf1−/− MC38 tumor in WT and Myd88−/−Trif−/− (double mutant) mice on day 17. For (A), (G), and (H) plots, *p ≤ 0.05; **p < 0.01; ***p < 0.001; ****p < 0.0001 by Mann-Whitney U/Wilcoxon rank-sum test.

