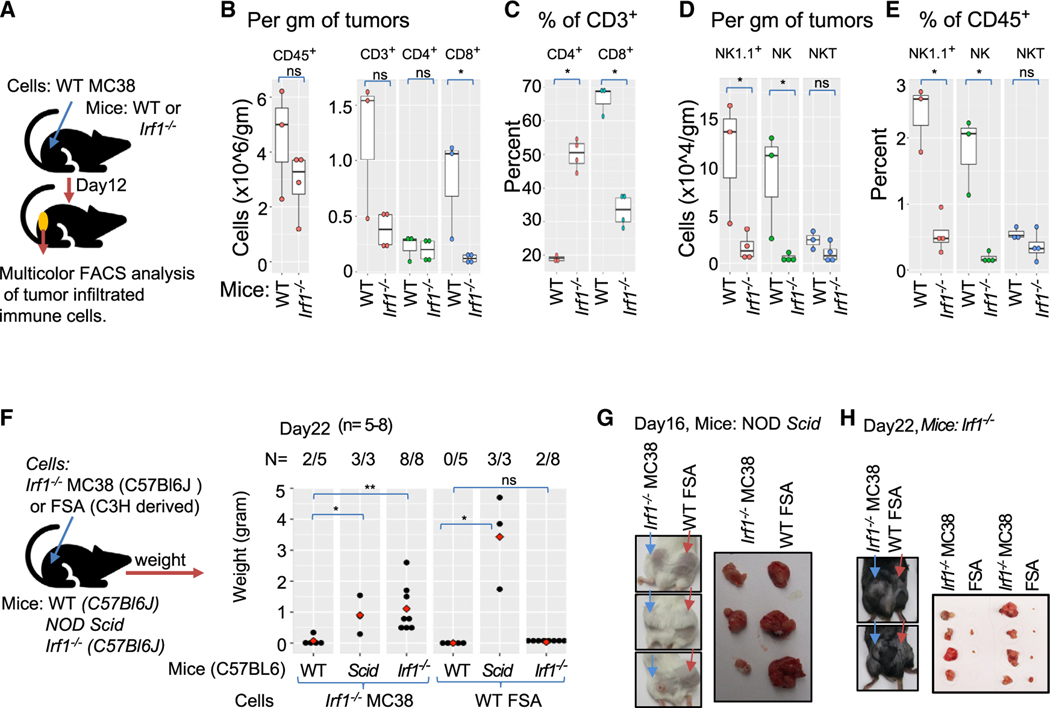
Figure 5. IRF1 expression in the host microenvironment is required for the clearance of Irf1−/− tumors.
(A) Experimental scheme for (B)–(E).
(B) Left panel shows total CD45+ cells/gram of tumors, and right panel displays CD45+CD3+, CD3+CD4+, and CD3+CD8+ T cells/gram of WT tumors in WT or Irf1−/− mice.
(C) Frequency of CD4+ and CD8+ T cells relative to CD3+ cells in WT tumors grown in WT (n = 3) and Irf1−/− mice (n = 4).
(D) Infiltration of “total NK1.1+,” “NK,” and “NKT” cells per gram of WT tumors from WT and Irf1−/− mice.
(E) Frequency of “total NK1.1”, “NK” and “NKT” cells relative to CD45+ cells infiltrated in WT tumors grown in WT (n = 3) and Irf1−/− (n = 4) mice.
(F) Left panel: schematic representation of experimental setup to monitor for (F)–(H). Right panel: weight of Irf1−/− MC38 (syngeneic; first 3 columns) and FSA (allogeneic; last 3 columns) subcutaneous tumors grown in WT (C57Bl6/J), NOD/Scid, or Irf1−/− mice for 22 days.
(G) Images of Irf1−/− MC38- or FSA-tumor-bearing mice (left panel) and harvested tumors (right panel) on day 16 in NOD/Scid mice.
(H) Images of tumor-bearing mice (left panel) and harvested tumors (right panel) on day 22 in Irf1−/− mice. For (B)–(F) plots, *p ≤ 0.05; **p < 0.01; ***p < 0.001; ****p < 0.0001 by Mann-Whitney U/Wilcoxon rank-sum test.

