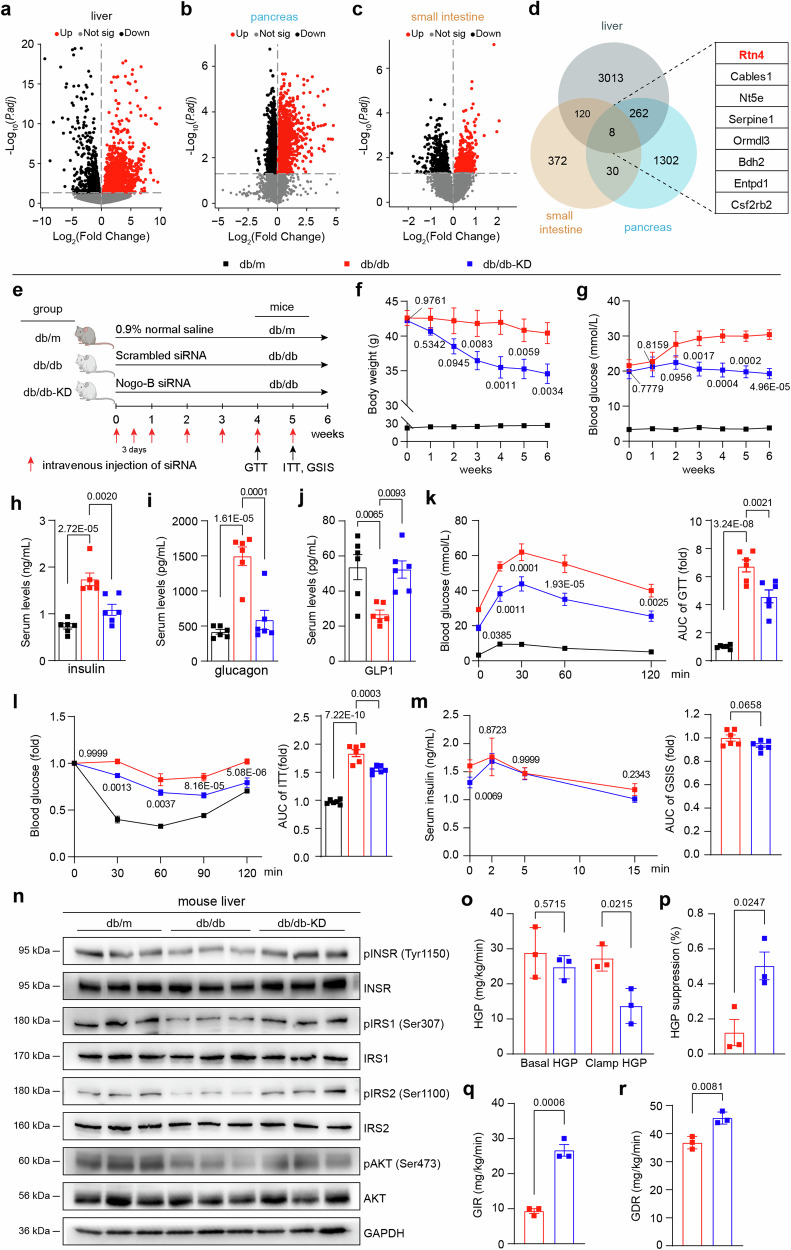
Fig. 1. Nogo-B knockdown ameliorates spontaneous T2DM in db/db mice.
Volcano plot depicting differential transcriptome in the liver (a), pancreas (b), and small intestine (c) of db/db mice. Red dots represent up-regulated genes, while black dots represent down-regulated genes. d Identification of candidate genes upregulated in the liver, pancreas, and small intestine of T2DM mice. e Experimental design for siRNA injection in vivo. db/db mice were injected with scrambled siRNA or Nogo-B siRNA, and db/m mice were injected with 0.9% normal saline as the healthy control. f Body weight of mice (n = 6 mice per group). g Fasted glucose levels of mice (n = 6 mice per group). h–j Serum levels of insulin, glucagon and GLP1 of mice (n = 6 mice per group). k Oral glucose tolerance test (OGGT) and area under the curve (AUC) analysis of mice (n = 6). l Insulin tolerance test (ITT) and AUC analysis of mice (n = 6 mice per group). m Glucose stimulated insulin secretion (GSIS) test and AUC analysis of mice (n = 6 mice per group). n pINSR, INSR, pIRS1, IRS1, pIRS2, IRS2, pAKT and AKT protein levels in mouse liver (n = 6 mice per group). o Hepatic glucose production (HGP) under basal and clamp conditions of mice (n = 3 mice per group). HGP suppression (p), glucose infusion rate (GIR, q),and glucose disposal rate (GDR, r) of mice (n = 3 mice per group). Data are expressed as the mean ± SEM. The p values of (a–c) were calculated by two-sided test and adjusted for p values by the Benjamini-Hochberg method to control for false positives due to multiple comparisons. The p values of (f–l) were calculated by one-way ANOVAs. The p values of (m, o–r) were calculated by two-tailed Student’s t test. The p values of (f, g, k, l) are indicated as db/db-KD group vs. db/db group. Source data are provided as a Source Data file.

