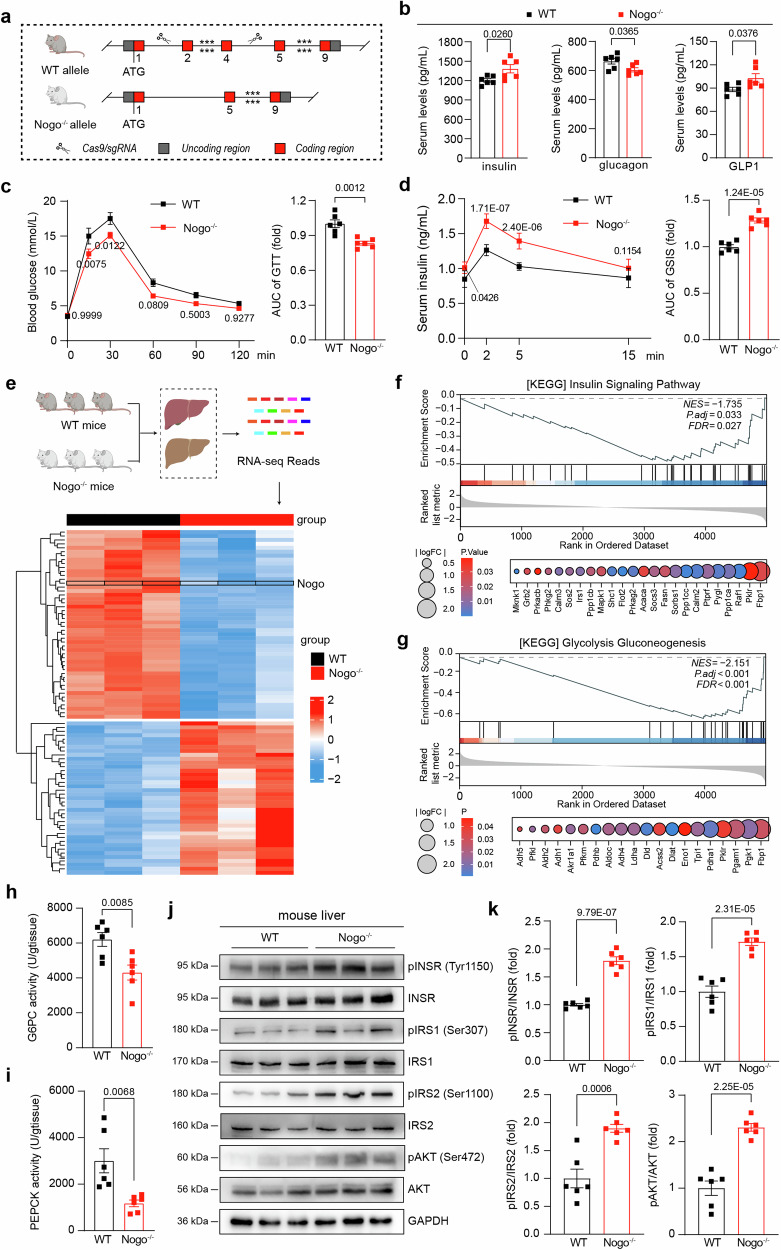
Fig. 2. Nogo-B deficiency promotes glucose metabolism and activates the insulin signaling pathway.
a A strategy for generating Nogo−/− mice. b Serum levels of insulin, glucagon and GLP1 of normal chow-fed 8-week-old Nogo−/− mice and their wild-type (WT) littermates (n = 6 mice per group). c OGTT and AUC analysis of normal chow-fed 8-week-old Nogo−/− mice and their WT littermates (n = 6 mice per group). d GSIS and AUC analysis of normal chow-fed 8-week-old Nogo−/− mice and their WT littermates (n = 6 mice per group). e Heatmap analysis of bulk RNA-seq data from livers of normal chow-fed 8-week-old Nogo−/− mice and their WT littermates (n = 3 mice per group). f, g GSEA in insulin signaling pathway and the glycolysis-gluconeogenesis pathway. The enzyme activity of G6PC (h) and PEPCK (i) in the liver of normal chow-fed 8-week-old Nogo−/− mice and their WT littermates (n = 6 mice per group). j, k pINSR, INSR, pIRS1, IRS1, pIRS2, IRS2, pAKT, and AKT protein levels in mouse liver and analysis of band density, the experiment was repeated at least three times (n = 6 mice per group). Data are expressed as the mean ± SEM. The p values were calculated by two-tailed Student’s t test. Source data are provided as a Source Data file.

