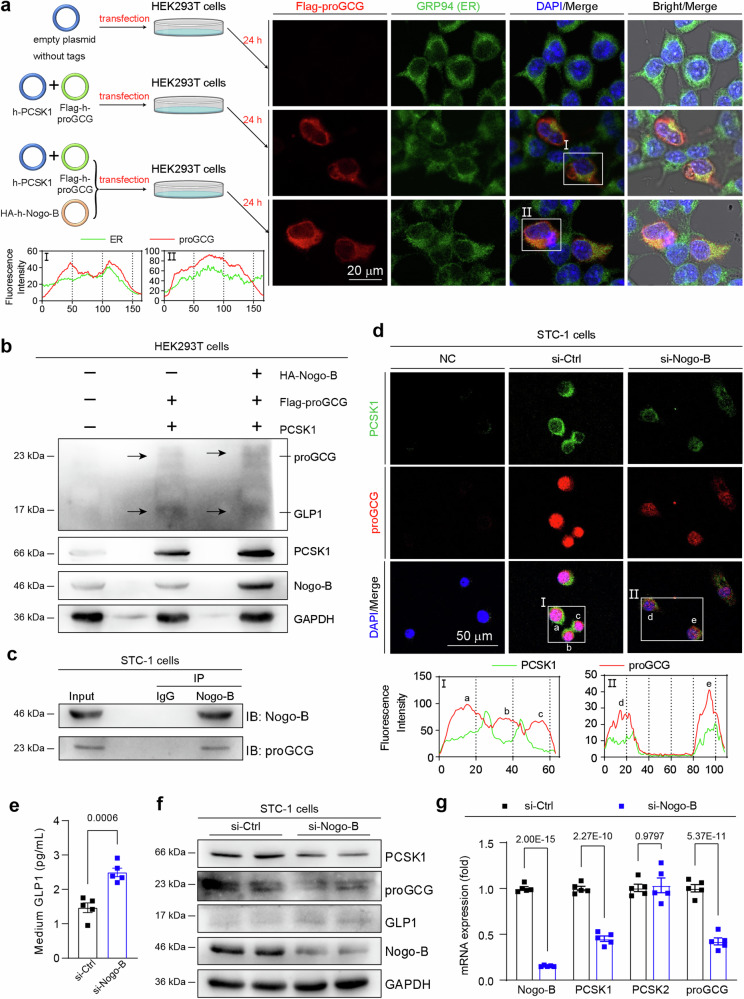
Fig. 4. Nogo-B inhibits PCSK1-mediated cleavage of proGCG in STC-1 cells.
a Representative images of immunofluorescence staining (ER, green; proGCG, red; DAPI, blue) of HEK293T cells transfected with human-derived proGCG and PCSK1. Overexpression of Nogo-B detects the localization of proGCG on the ER. I-II: The intensity distribution of the marker scans in the boxed area shows the spatial distribution and fluorescence intensity of the different markers. Enhanced co-localization is indicated by the resemblance in shape of the intensity distribution curves and the increased number of overlaps. The experiment was conducted independently on three occasions. b Detection of Nogo-B overexpression on exogenous PCSK1 cleavage of exogenous proGCG by Western blot in HEK293T cells (n = 3 biological replicates). c Endogenous co-IP assay with Nogo-B and proGCG in STC-1 cells (n = 3 biological replicates). d Representative images of immunofluorescence staining (PCSK1, green; proGCG, red; DAPI, blue) of STC-1 cells transfected with scrambled siRNA (si-Ctrl) or Nogo-B siRNA (si-Nogo-B) to detect co-localization of proGCG and PCSK1. I-II: The intensity distribution of the marker scans in the boxed area shows the spatial distribution and fluorescence intensity of the different markers. Enhanced co-localization is indicated by the resemblance in shape of the intensity distribution curves and the increased number of overlaps. The experiment was conducted independently on three occasions. e GLP1 levels in the culture medium of STC-1 cells transfected with si-Ctrl or si-Nogo-B (n = 5 biological replicates). f PCSK1, proGCG, GLP1 and Nogo-B protein levels in STC-1 cells transfected with si-Ctrl or si-Nogo-B (n = 6 biological replicates). g Nogo-B, PCSK1, PCSK2 and proGCG mRNA levels in STC-1 cells transfected with si-Ctrl or si-Nogo-B (n = 5 biological replicates). All experiments were repeated at least three times. Data are expressed as the mean ± SEM. The p values were calculated by two-tailed Student’s t test. Source data are provided as a Source Data file.

