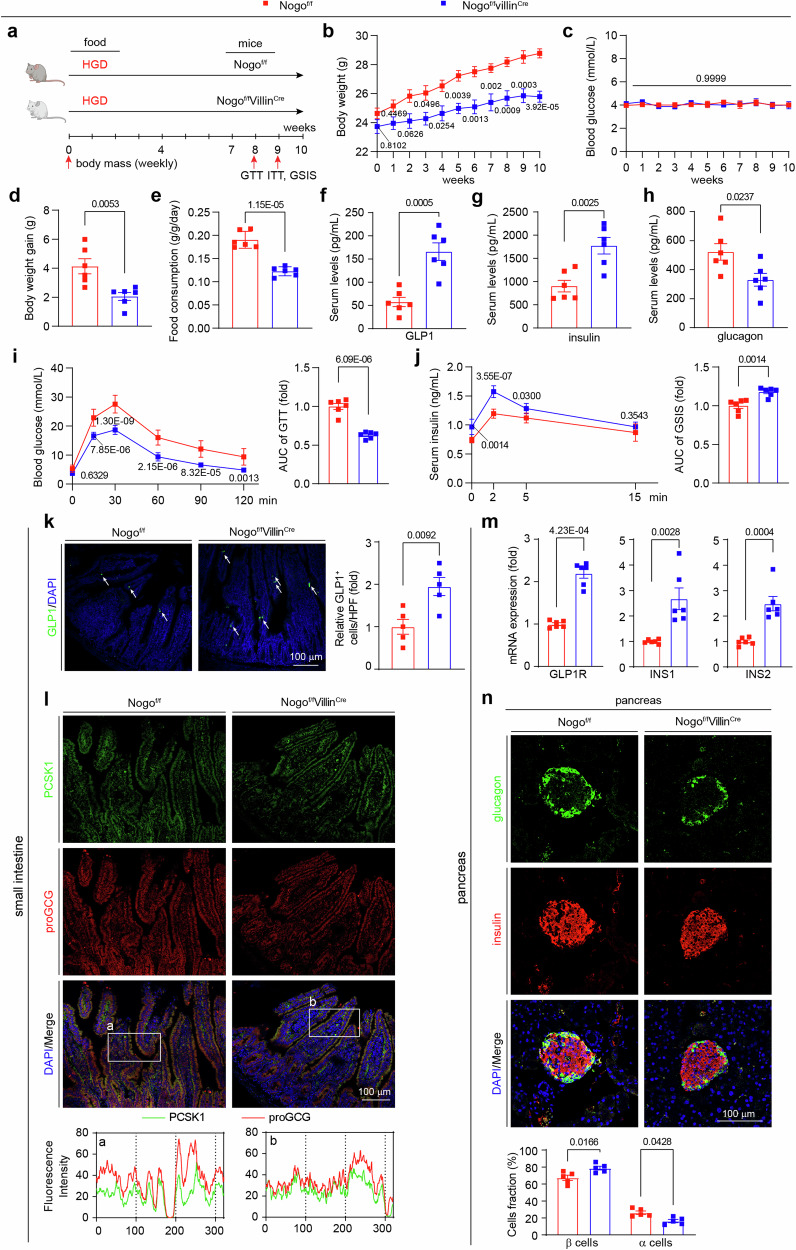
Fig. 5. Intestinal Nogo-B knockout increases GLP1 levels in mice.
a Experimental design in vivo. Nogof/fVillinCre and their littermate controls (Nogof/f) received high glucose diet (HGD) for 10 weeks and were conducted the assays as scheduled. b Body weight of Nogof/fVillinCre and Nogof/f mice (n = 6 mice per group). c Fasted glucose levels of mice (n = 6). d Body weight gain of Nogof/fVillinCre and Nogof/f mice after 10 weeks on HGD (n = 6 mice per group). e Food consumption of Nogof/fVillinCre and Nogof/f mice (n = 6 mice per group). f–h Levels of GLP1, insulin and glucagon of Nogof/fVillinCre and Nogof/f mice (n = 6 mice per group). i OGTT and AUC analysis of Nogof/fVillinCre and Nogof/f mice (n = 6 mice per group). j GSIS and AUC analysis of Nogof/fVillinCre and Nogof/f mice (n = 6 mice per group). k Representative images of immunofluorescence staining for GLP1 (GLP1, green; DAPI, blue) of small intestine from HGD-fed Nogof/fVillinCre and Nogof/f mice. White arrowheads indicate GLP1-positive signals. Quantification of results were expressed as the mean numbers of GLP1-positive cells in 5 high-power fields (HPFs) (n = 5 mice per group, right panel). l Representative images of immunofluorescence staining PCSK1 and proGCG (PCSK1, green; proGCG, red; DAPI, blue) of small intestine from HGD-fed Nogof/fVillinCre and Nogof/f mice. a, b The intensity distribution of the marker scans in the boxed area shows the spatial distribution and fluorescence intensity of the different markers. Enhanced co-localization is indicated by the resemblance in shape of the intensity distribution curves and the increased number of overlaps. The experiment was conducted independently on three occasions. m The mRNA levels of GLP1R, INS1, and INS2 in the pancreas of Nogof/fVillinCre and Nogof/f mice after 10 weeks on HGD (n = 5 mice per group). n Islet images of Nogof/fVillinCre and Nogof/f mice after 10 weeks on HGD (glucagon, green; insulin, red; DAPI, blue). Analysis of β-cell or α-cell as the percentage of pancreatic cells (n = 5 mice per group, bottom panel). Data are expressed as the mean ± SEM. The p values were calculated by two-tailed Student’s t test. Source data are provided as a Source Data file.

