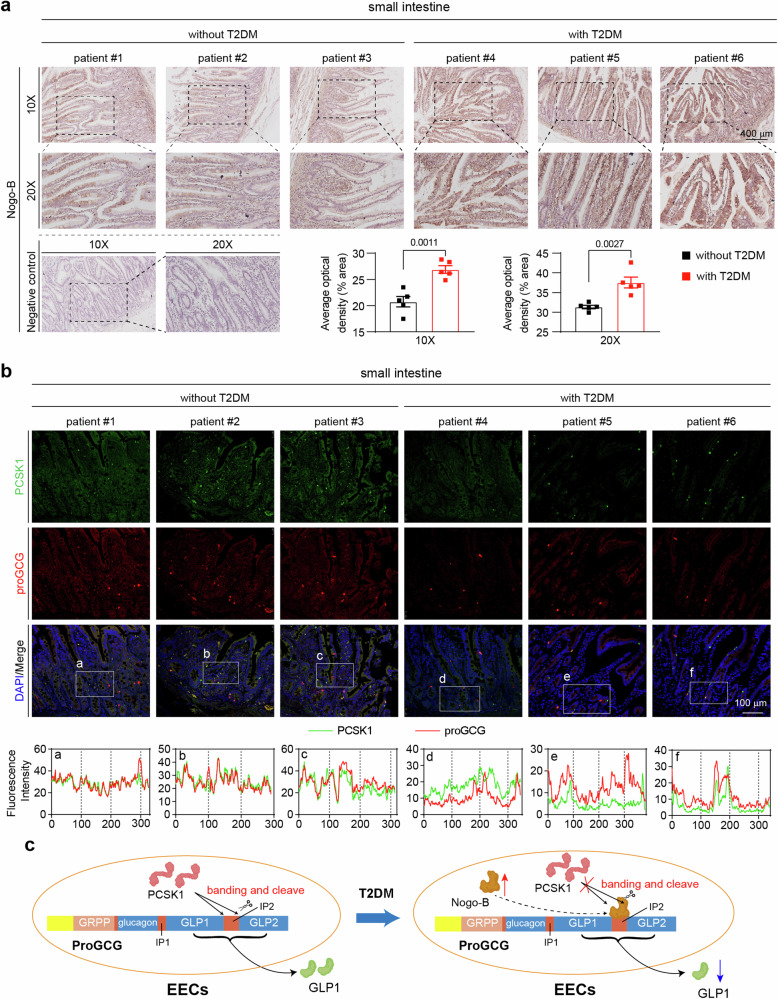
Fig. 7. Nogo-B expression is elevated in the small intestine of T2DM patients.
a Representative images of immunohistochemical staining of Nogo-B in small intestine from patients with or without T2DM. Quantification of Nogo-B density from 5 individual images (n = 5 patients per group). b Representative images of immunofluorescence staining (PCSK1, green; proGCG, red; DAPI, blue) of small intestine from patients with or without T2DM. a–f The intensity distribution of the marker scans in the boxed area shows the spatial distribution and fluorescence intensity of the different markers. Enhanced co-localization is indicated by the resemblance in shape of the intensity distribution curves and the increased number of overlaps. The experiment was conducted independently on three occasions. c working model of Nogo-B affecting GLP1 levels. Data are expressed as the mean ± SEM. The p values were calculated by two-tailed Student’s t test. Source data are provided as a Source Data file.

