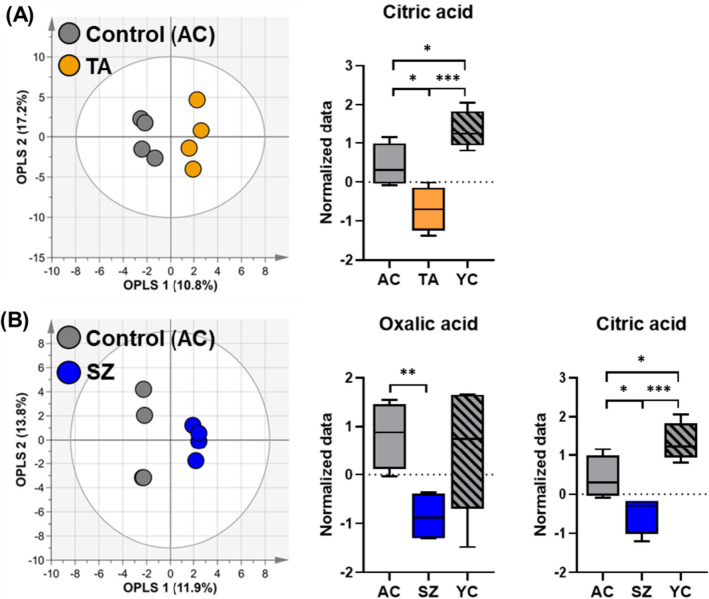
Fig. 2.
A Score plot of the OPLS-DA models based on the 49 metabolites obtained in the plasma of AC and TA groups. Box plots show significant differences in ANOVA based on 49 metabolites identified in the plasma of AC, TA, and YC groups. B Score plot of the OPLS-DA models based on the 49 metabolites identified in the plasma of AC and SZ groups. Box plots show significant differences in ANOVA based on 49 metabolites in the plasma samples of AC, SZ and YC groups. The OPLS-DA model represents the difference between the two groups. *p < 0.05, **p < 0.01, and ***p < 0.001. AC, TA, and SZ groups were fed with 200 mg/kg/day normal, Triticum aestivum sprout extract, and Schisandra chinensis extract diets for 10 weeks, respectively

