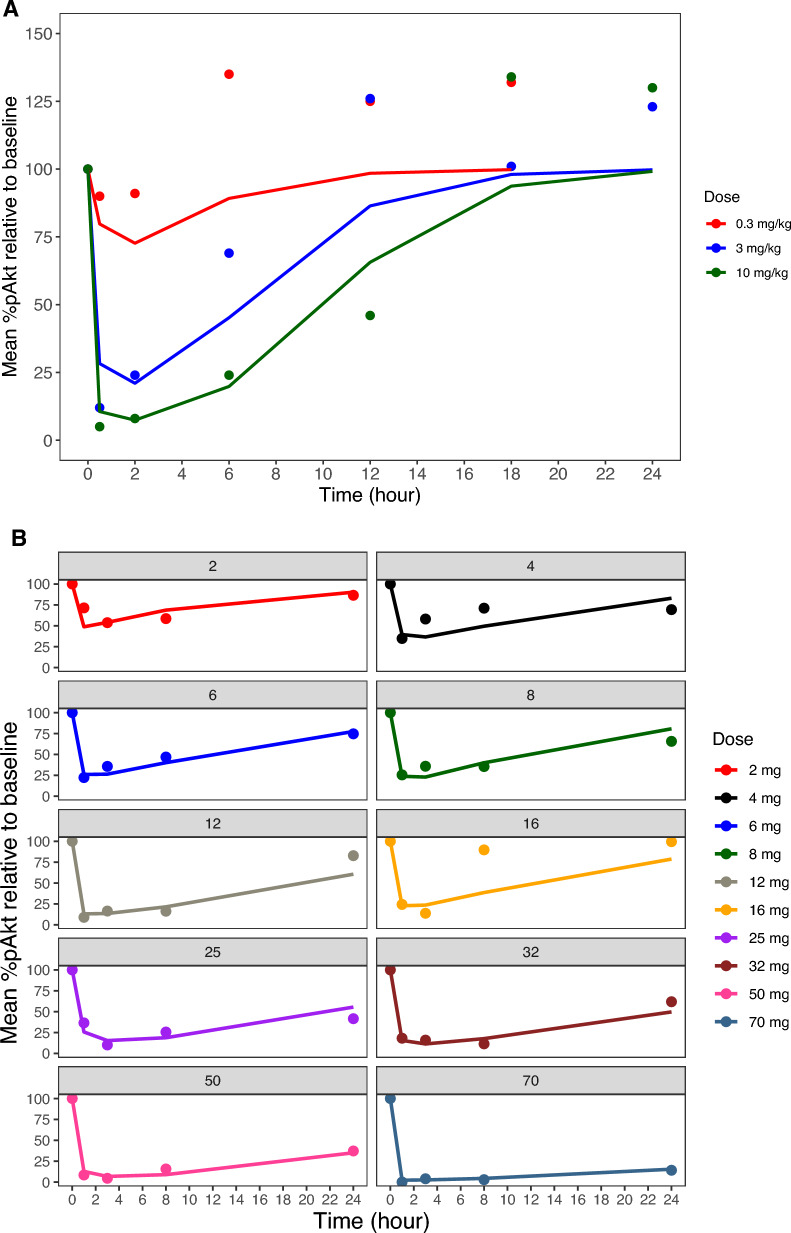
Fig. 1.
Mean observed and predicted %pAkt relative to baseline versus time. A Tumor tissue mean %pAkt relative to baseline from 786-O xenografts following oral administration of 0.3, 3, and 10 mg/kg apitolisib. B Surrogate plasma mean %pAkt relative to baseline from patients with advanced solid tumors (phase 1 studies) following oral administration of 2–70 mg apitolisib, stratified by dose. Observed mean %pAkt relative to baseline data is presented as dots, and the model predicted is presented as a solid line

