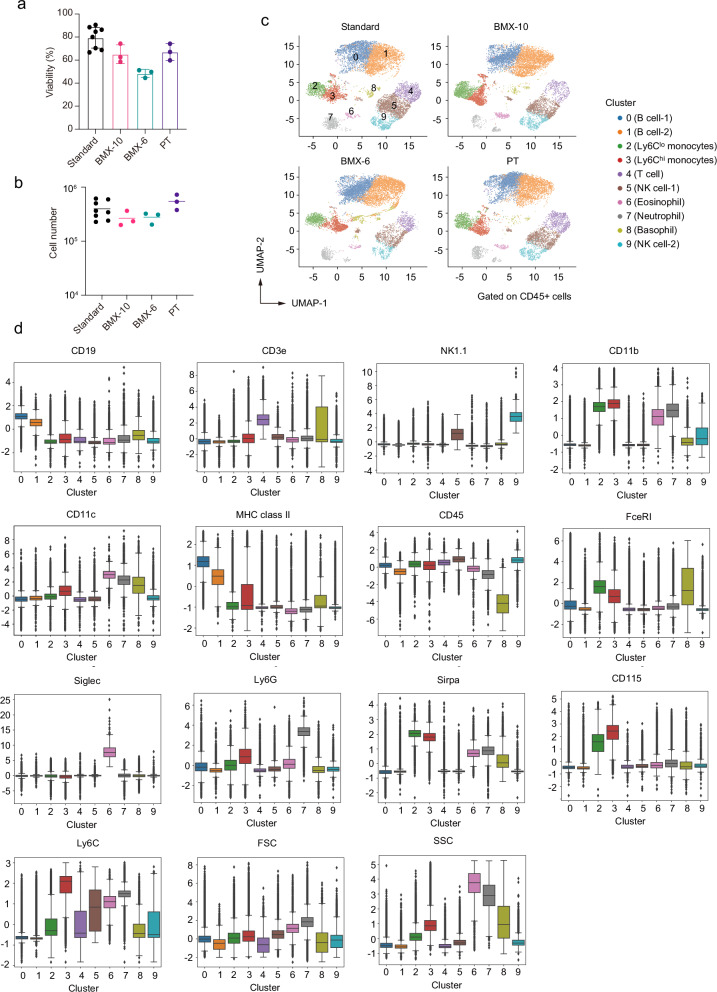
Fig. 4. High-dimensional analysis of flow cytometric data.
a Cell survival ratio of recovered cells in mouse blood using the Biological sample MiXture device (BMX). Triplicate experiments for each BMX condition were conducted using murine blood pooled from 16 mice. Average values are shown as boxes, and bars indicate standard deviation. “PT” indicates the method of using paper towels instead of BMXs for wrapping 7 ml blood collection tubes. For PT, the data in Fig. 1b (60 s) are shown again for comparison. “Standard” indicates the conventional method involving cryopreservation using the CP-1 solution in a 1.5 ml centrifuge tube, following the elimination of red blood cells with ammonium chloride solution. Paper towels were used for wrapping 1.5 ml tubes. In each experiment, the standard method was conducted as a control, and data (a total of 8 samples) were accumulated. b Recovered alive cell number after each cryopreservation method. Bars indicate average values. c Uniform manifold approximation and production (UMAP) plot of flow cytometric data from mouse blood mononuclear cells after the recovery from cryopreservation. Cell clusters are separated by colors and numbers in the plot. All samples were integrated for the analysis, and dots exhibit 10,000 cells randomly selected from each dataset. d Expression level of surface markers in each cluster. The box is drawn from the first quartile to the third quartile. Bars indicate values of the minimum, the maximum, and the sample median. Outliers are shown as dots.

