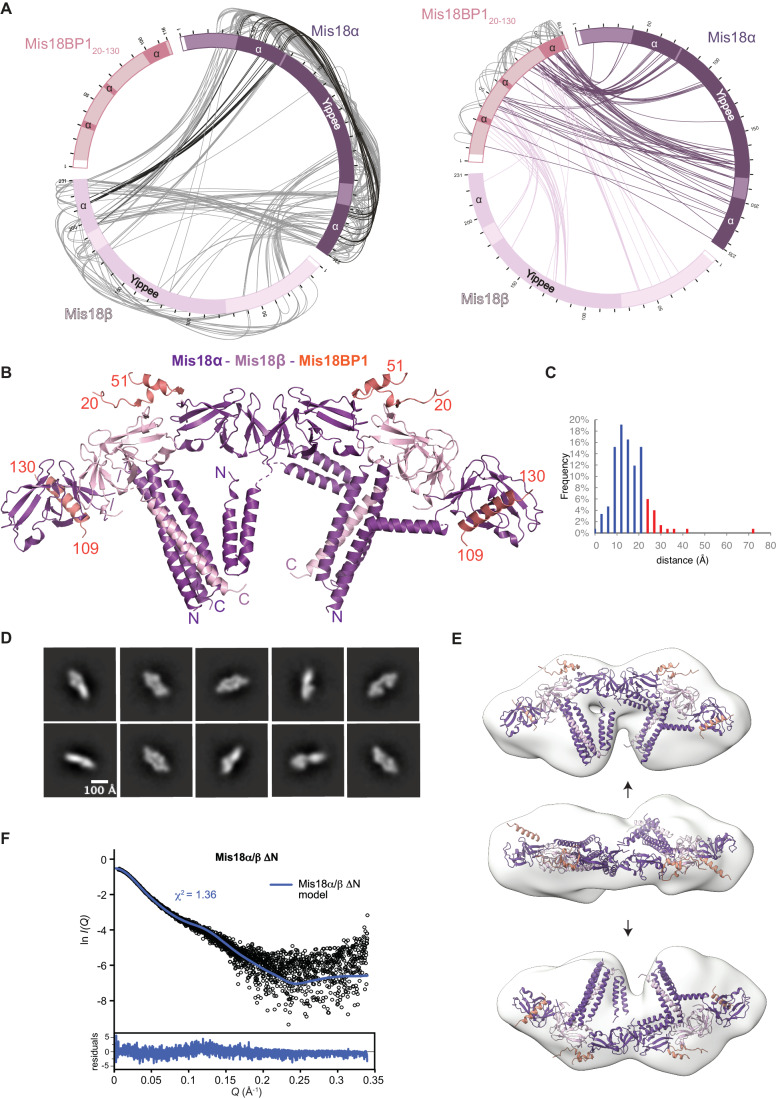
Figure 2. Mis18 complex oligomeric assembly requires multiple surfaces.
(A) Linkage map showing the sequence position and cross-linked residue pairs between the different Mis18core complex subunits, Mis18α, Mis18β and Mis18BP120-130. Left panel highlights cross-linked residues between Mis18α and Mis18β. Black lines highlight cross-links between N-terminal α-helix of Mis18α and C-terminal helical regions of proteins. Right panel highlights cross-links observed between (i) Mis18BP120-130 and Mis18α (purple), (ii) Mis18BP120-130 and Mis18β (light pink), (iii) Mis18BP120-130 self cross-links (light grey). White boxes represent residual residues left over from tag cleavage. Dark boxes show Yippee domains and regions of α-helices. (B) Model of the Mis18core complex generated using partial structures determined using X-ray crystallography and AlphaFold2 (Jumper et al, 2021) and cross-linking restrained molecular docking in EM maps. Mis18BP1 shown in salmon, Mis18α in purple and Mis18β in light pink. (C) Histograms show the percentage of satisfied or violated cross-links for structures modelled using MODELLER (Sali and Blundell, 1993). (D) Representative images of 2D classes from Mis18core particles picked using CryoSPARC (Punjani et al, 2017). Scale bar shows 100 Å. (E) Model (Class I) generated for Mis18core from negative staining EM analysis. This shows that the overall shapes of the Mis18core resemble a telephone handset with ‘ear’ and ‘mouth’ pieces. Arrows denote the different orientations shown. (F) Theoretical SAXS scattering curves of Mis18α/β ΔN model compared to experimental data.

