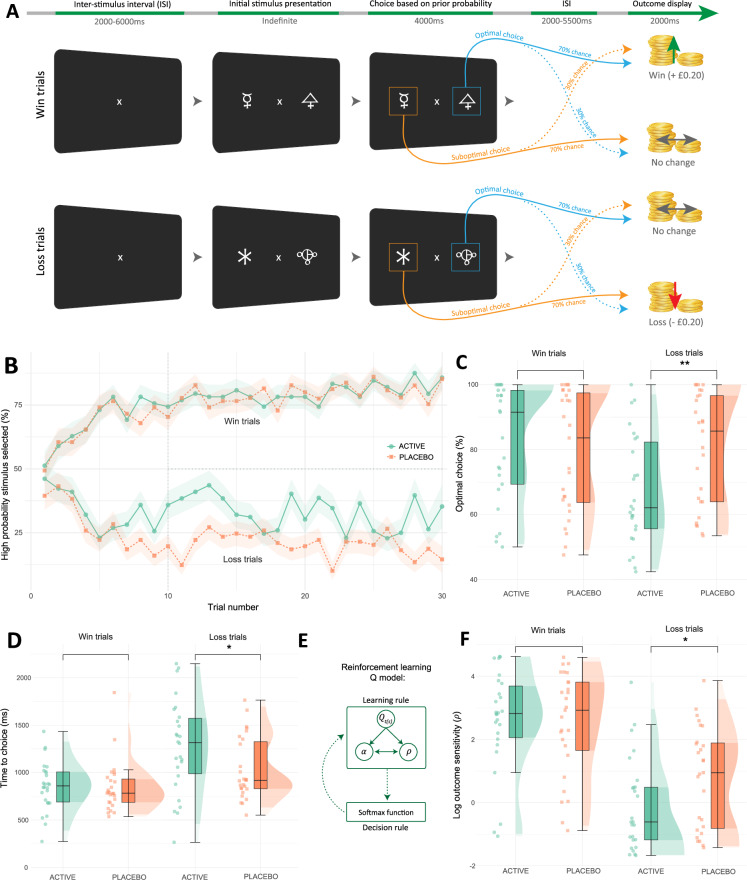
Fig. 2. Task procedure, computational modelling, and analyses of the probabilistic instrumental learning task.
A The task consists of choosing a symbol within a pair, with two interleaved pairs per task block. Each pair represents a high probability of winning (win trials) or high probability of loss (loss trials). Win trials (30 per block) result in winning or no change, while loss trials (30 per block) result in loss or no change. Within pairs, symbols had fixed reciprocal probabilities (70%, 30%), with outcomes displayed at trial end. Participants were instructed to make choices for most likely maximal monetary gain (awarded at study completion). B Group learning rates across trial types (blocks averaged). High probability stimulus selected (Y axis): mean percentage of high probability win or loss choices. The shaded area around lines represents standard error (SE). C Decreased optimal choices in the fenfluramine (active) group during loss trials via estimated margin means (EMM) (reward trials EMM( ± SE) = 0.68 ± 3.18, p = 0.8307; loss trials EMM = −8.62 ± 3.18, p = 0.0078, Cohen’s d = −0.75 [95% CI −1.30, −0.19]). D Increased response time (ms; milliseconds) in the fenfluramine group during loss trials (reward trials EMM = 13.9 ± 95.6, p = 0.8845; loss trials EMM = 246.0 ± 95.6, p = 0.0115, d = 0.71 [0.15, 1.26]). E The Q computational model contains two primary parts: a learning rule and decision rule. The learning rule describes trial-by-trial updates of value expectation (), and choice probability is determined via the decision rule. Model parameters alter distinct aspects of the decision-making process: outcome sensitivity () and learning rate () (see Supplementary Methods for details)64. F Decreased outcome sensitivity () in the fenfluramine group during loss trials (reward trials EMM = 0.10 ± 0.43, p = 0.8203; loss trials EMM = −0.90 ± 0.43, p = 0.0392, d = −0.57 [−1.11, −0.03]). B–D, F include N = 53 individuals; boxplots represent interquartile range (IQR); central line depicts the median. Whiskers represent ±1.5 IQR, encompassing most data points; half-violin plots depict the data distribution. ** p ≤ 0.01, * p ≤ 0.05 indicate group differences by two-tailed EMM tests (Bonferroni-Holm corrected). ISI Inter-stimulus interval.

