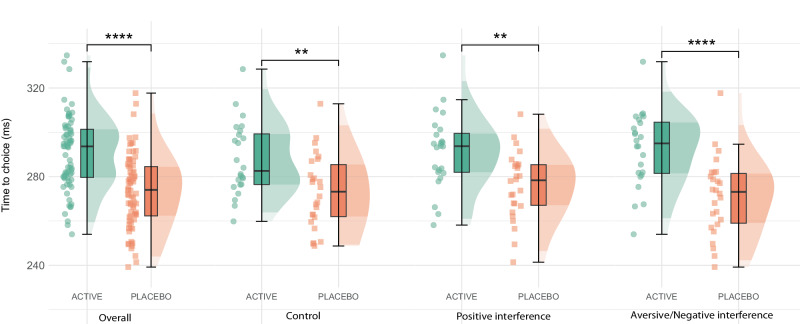
Fig. 4. Time to choice analysis for the Affective Go/No-Go Task.
General decreases in choice impulsivity (or, choice time for correct go trials) (ms; milliseconds) were observed in the fenfluramine (active) group via estimated marginal means tests (EMM) (overall EMM = 17.2 ± 2.72, p = 3.733661e-09, d = 1.03 [0.68, 1.37]; control EMM = 14.6 ± 4.71, p = 0.0024, d = 0.88 [0.31, 1.44]; positive interference EMM = 15.4 ± 4.71, p = 0.0013, d = 0.93 [0.36, 1.50]; aversive interference EMM = 21.3 ± 4.71, p = 1.31162e-5, d = 1.28 [0.70, 1.86]); this effect was most pronounced during aversive interference. Figure includes data for N = 50 individuals; boxplots represent the interquartile range (IQR), while the central line depicts the median. The whiskers extend to approximately ± 1.5 times the IQR, encompassing the bulk of the data points; half-violin plots depict the data distribution; **** p ≤ 0.0001, ** p ≤ 0.01 indicate group differences by two-tailed EMM tests (Bonferroni-Holm corrected).

