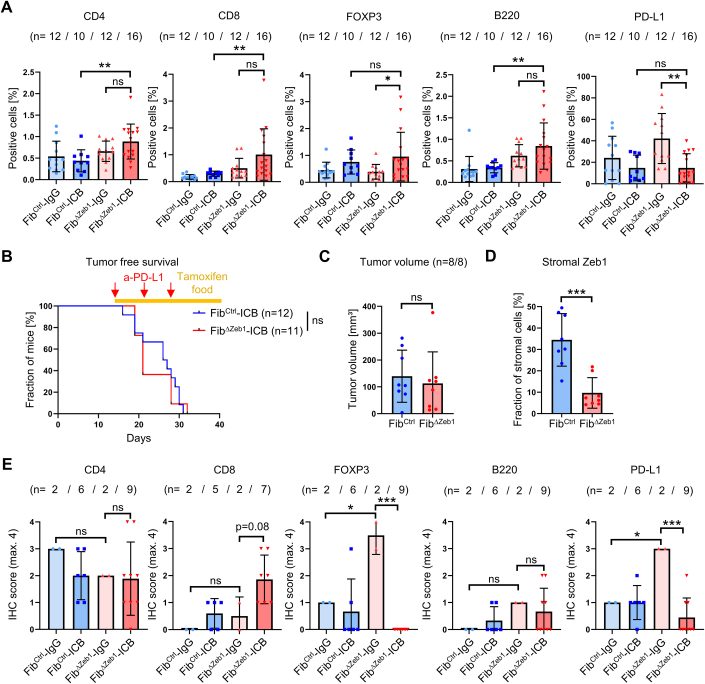
Figure EV5. Monitoring of immune cell infiltration after ICB and effect of late-stage deletion of Zeb1 on ICB.
(A) IHC-based quantification of immune cell infiltration and PD-L1 expression in tumors from FibCtrl and FibΔZeb1 mice after orthotopic transplantation of AKPre organoids and intraperitoneal injection of a-PD-L1 antibodies or control IgGs. Numbers of experimental mice per condition are indicated (CD4, CD8, FOXP3, B220, PD-L1: P = 0.0032, 0.0076, 0.6442, 0.0027, >0.9999 (FibCtrl-ICB vs FibΔZeb1-ICB), p = 0.1568, 0.0525, 0.0304, 0.2150, 0.0004 (FibΔZeb1-IgG vs FibΔZeb1-ICB), Šídák’s multiple comparisons test). IgG-treated mice contributed to initial AKPre analysis (Fig. 1). (B) Kaplan–Meier analysis showing tumor-free survival of FibCtrl and FibΔZeb1 mice after orthotopic transplantation of AKPre organoids and intraperitoneal injection of a-PD-L1 antibodies or control IgGs, as indicated by red arrows. Recombination of Zeb1 was induced by tamoxifen food starting from day (d) 14. Mice were considered tumor-free if no tumor was detected by palpation. Numbers of experimental mice per condition are indicated (P = 0.7583, Mantel–Cox test). (C) Quantification of tumor volumes after orthotopic transplantation of AKPre tumor organoids and ICB with late recombination of Zeb1. Only tumors collected after d28 were included in this analysis (n = 8 independent mice, P = 0.6276, Student’s t test). (D) IF-based quantification of stromal cells expressing ZEB1 (n = 8/8 independent mice for FibCtrl/FibΔZeb1, P = 0.0002, Student’s t test). (E) IHC-based quantification of immune cell infiltration and PD-L1 expression in AOM/DSS tumors from FibCtrl and FibΔZeb1 mice receiving ICB (2 intraperitoneal injections of a-PD-L1 and a-CTLA-4 antibodies or control IgGs per week starting at d70 of AOM/DSS tumorigenesis). Numbers of experimental mice per condition are indicated (CD4, CD8, FOXP3, B220, PD-L1: P = 0.9902, 0.0802, <0.0001, 0.0070, 0.0003 (FibΔZeb1-IgG vs FibΔZeb1-ICB), P = 0.6241, 0.7615, 0.0070, 0.3163, 0.0144 (FibCtrl-IgG vs FibΔZeb1-IgG), Šídák’s multiple comparisons test). Data information: Data are presented as mean ± SD (A, C–E). Source data are available online for this figure.

