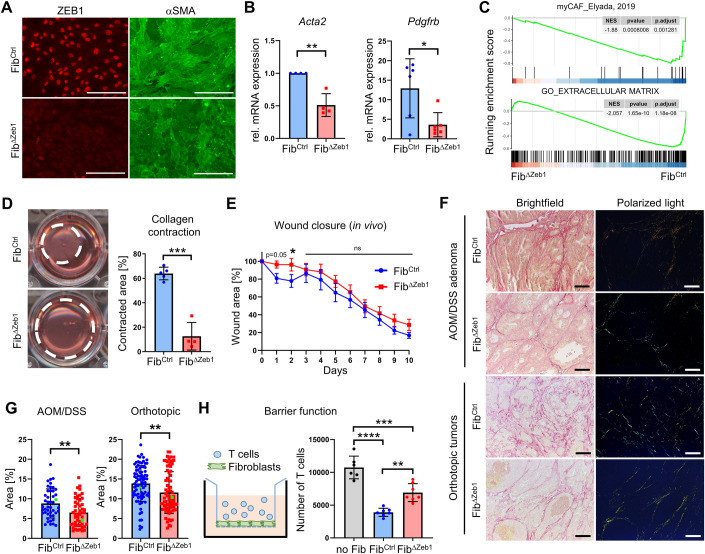
Figure 3. ZEB1 is critically involved in myofibroblast differentiation and functionality.
(A) Representative IF staining of ZEB1 and αSMA in fibroblasts after in vitro recombination. (B) qRT-PCR analysis of myofibroblast markers Acta2 and Pdgfrb in fibroblasts after in vitro recombination, (n = 4/6; 2 independent fibroblast lines per genotype in 2/3 biological replicates for Acta2/Pdgfrb, Acta2: P = 0.0014, Pdgfrb: P = 0.0190, Student’s t test). (C) Gene set enrichment analysis using myCAF and extracellular matrix (GO: 0031012) signatures. (D) Representative images and quantification of collagen contraction assay (n = 5/4 independent FibCtrl/FibΔZeb1 lines; P < 0.0001, Student’s t test). (E) Quantification of relative wound area in FibCtrl and FibΔZeb1 mice during a skin wound healing model (n = 16/22), day 1: P = 0.0539, day 2: P = 0.0326, two-way ANOVA). (F, G) Representative images (F) and quantification (G) of Picrosirius red staining of tumor sections from FibCtrl and FibΔZeb1 mice after AOM/DSS and orthotopic transplantation (45/50 image sets derived from n = 13/9 FibCtrl/FibΔZeb1 mice for AOM/DSS and 84/76 image sets derived from n = 8/9 FibCtrl/FibΔZeb1 mice for the orthotopic tumor model, AOM/DSS: P = 0.0023, orthotopic: P = 0.0015, Mann–Whitney test). Areas from representative images are marked in green. (H) Quantification of T-cell migration through a transwell insert alone or with a layer of fibroblasts after in vitro recombination of Zeb1 (n = 7 independent lines, no Fib vs FibCtrl: P < 0.0001, no Fib vs FibΔZeb1: P = 0.0002, FibCtrl vs FibΔZeb1: P = 0.0012, Tukey’s multiple comparisons test). Data information: Data are presented as mean ± SD (B, D, G, H) or mean ± SEM (E). Scale bars represent 200 µm (A) or 80 µm (F). Source data are available online for this figure.

